Urban inland inundation modeling prediction method

A technology of urban waterlogging and prediction methods, applied in the direction of prediction, instruments, data processing applications, etc., can solve problems that cannot be prevented in time, and achieve the effect of great reference value and minus data processing

Active Publication Date: 2017-05-31
HEFEI UNIV
4 Cites 13 Cited by

AI-Extracted Technical Summary

Problems solved by technology

[0005] Aiming at the problem existing in the prior art that urban waterlogging cannot be prevented in time before it occurs, the purpose of the pres...

Method used

(4) the calculation of urban precipitation, draw the urban precipitation frequency, frequency and classification table by the daily average precipitation during the annual precipitation peak period of the statistical city, by querying Hefei's annual precipitation in the last forty years Daily precipitation during the peak period, calculate the daily average precipitation during the peak period of precipitation, draw the frequency, frequency and grade division ...

Abstract

The invention discloses an urban inland inundation modeling prediction method which comprises the following steps: acquiring probability of urban inland inundation by using a modeling method; according to the situation that urban inland inundation is caused as an urban water drainage amount is smaller than an urban precipitation amount because of natural situations, respectively calculating the urban water drainage amount and the urban precipitation amount in a symbolic-graphic combination mode; converting the urban water drainage amount and the urban precipitation amount into an urban water drainage effect diagram and an urban precipitation effect diagram by using software, and overlapping the diagrams, so as to obtain an urban ponding effect diagram. By adopting the processing mode, massive tedious data processing is reduced, urban landforms in practical situations can be taken into account, and the latest urban water drainage situations can be acquired, so that great reference values can be made, and urban inland inundation can be predicted by analyzing the urban ponding effect diagram.

Application Domain

Technology Topic

Image

  • Urban inland inundation modeling prediction method

Examples

  • Experimental program(1)

Example Embodiment

[0033] Example:
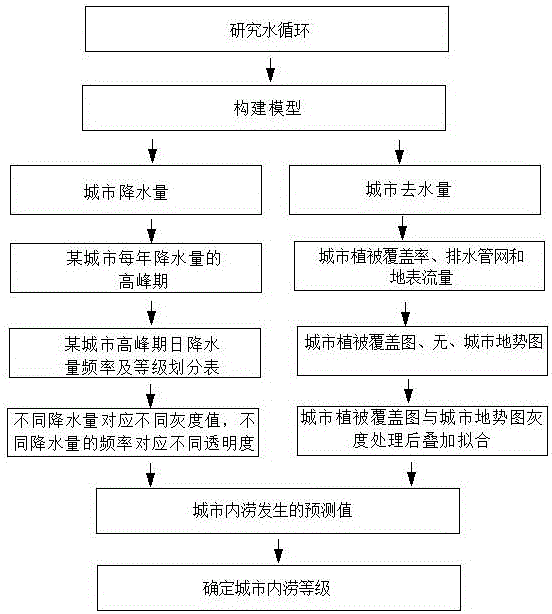
[0034] see figure 1 , a method for modeling and predicting urban waterlogging, including the following steps:
[0035] A method for modeling and predicting urban waterlogging, comprising the following steps:
[0036] (1) Build a model. Through the urban water circulation system, a white-box test method is used to establish an urban waterlogging model. The model is as follows:
[0037] M=H-Q;
[0038] Among them: M is the urban water accumulation, which refers to the difference between the urban precipitation and the urban water removal;
[0039] H is the urban precipitation in a certain area per unit time;
[0040] Q is the amount of water removed from the city, which refers to the amount of water absorbed by the vegetation soil, the drainage pipe network system and the surface flow;
[0041] (2) Determine the time period of waterlogging occurrence, query the peak period of the city's annual precipitation, and the probability of waterlogging in the city during the peak period of the city's precipitation is the greatest. By querying the monthly precipitation in Hefei in the past 40 years, obtain the monthly average Precipitation, the three months with the largest monthly average precipitation are selected as the peak period of precipitation. In this way, the urban precipitation in recent years can be calculated scientifically, making the data closer to the actual value in the future;
[0042] (3) Determine the level of urban waterlogging, and set the urban waterlogging into four levels of micro-risk, low-risk, medium-risk and high-risk, and each level determines the range of urban waterlogging depth;
[0043] (4) Calculation of urban precipitation, by calculating the daily average precipitation during the peak period of annual precipitation in the city, the frequency, frequency and grade classification table of urban precipitation can be obtained. Calculate the daily average precipitation during the peak period of precipitation, draw the frequency, frequency and grade division table of urban precipitation, and divide the different daily average precipitation into four types of precipitation: light rain, moderate rain, heavy rain and heavy rain Level, count the precipitation, precipitation frequency and precipitation frequency corresponding to different precipitation levels, predict the urban precipitation in advance by the frequency estimation probability, and make the data more accurate through tedious and rigorous data statistics;
[0044](5) Graphical representation of urban precipitation, taking the specific value of urban precipitation as the value in the image processing, and superimposing the processed image to obtain the urban precipitation effect map; the four precipitation levels of light rain, moderate rain, heavy rain and heavy rain correspond to four different images. For pictures, use different precipitation to correspond to different grayscale values, and different precipitation frequencies to correspond to transparency values. In Photoshop software, select four pictures with grayscales of 62, 92, 102, and 222 to represent the probability of rainfall, and four different pictures The effect map of urban precipitation is obtained by superimposing, which reduces a lot of data processing, clearly and intuitively shows that all parts of the city are subject to the same amount of precipitation at the time of prediction, and understand the situation of water accumulation in various places after precipitation in the city;
[0045] (6) Calculation of urban water removal, obtain the urban topographic map and urban vegetation coverage map, and perform grayscale processing on the pictures. After the grayscale processing, the urban topographic map and the urban vegetation coverage map are superimposed and fitted to obtain the urban water removal effect. Figure, the processed pictures are superimposed to obtain the urban precipitation effect map, and the urban precipitation effect map and the urban water removal effect map are superimposed to obtain the urban water accumulation effect map; the urban water removal amount includes the urban vegetation coverage, drainage pipe network and surface flow, urban vegetation The coverage rate, drainage pipe network and surface flow correspond to the urban vegetation coverage map, none, and the urban topography map respectively. The urban vegetation coverage map and the urban topography map are respectively processed in grayscale, and the different grayscale maps obtained are superimposed to obtain the urban water removal. Rendering: The vegetation coverage map of Hefei City and the topographic map of Hefei City were intercepted from Google Earth and Letu software, and the two pictures were imported into Photoshop software for grayscale processing. A complete image is composed of red, green and blue. It consists of three channels. The thumbnails of the red, green, and blue channels are displayed in grayscale. Different grayscale levels are used to represent the proportion of "red, green, and blue" in the image. The pure white in represents the highest brightness of the color light here, and the brightness level is 255. The grayscale processing map of Hefei's vegetation coverage and terrain is obtained. After processing, the two pictures are superimposed; in the process of superimposing and fitting, First use the topographic map after grayscale processing as the background layer, adjust the transparency to 100%, then put the grayscale-processed vegetation cover image on the top layer, adjust the transparency so that the contents of both layers can be seen at the same time, manually adjust, coincide the coordinates Align and align, adjust the transparency to 50% before merging, and control the filling of the two images the same; through the pictures, you can simply understand the water removal situation in different parts of the city. The larger the grayscale overlay in the picture, the darker the place. Indicates that there is less vegetation and the terrain is low, and the probability of water accumulation is greater. The smaller the grayscale superposition, the whiter the place, which means that there is more vegetation and the terrain is high, and the probability of water accumulation is smaller;
[0046] (7) Determine the level of urban waterlogging, determine the grayscale value of waterlogging occurrence in a city, and compare the grayscale values ​​of different places in the urban waterlogging effect map one by one to obtain the predicted value of waterlogging occurrence in different parts of the city. Corresponding to the urban waterlogging grade, the urban waterlogging grade is obtained; the possibility of urban waterlogging occurrence is obtained through the modeling method. According to the fact that the urban waterlogging is due to the natural situation, the water removal is less than the precipitation, and the combination of numbers and shapes is used to calculate the urban water removal and Urban precipitation, using software to convert urban water removal and urban precipitation into urban water removal effect map and urban precipitation effect map, and superimpose again to get urban water accumulation effect map. This processing method reduces a lot of tedious data processing, and at the same time Taking into account the actual situation of urban landforms, the latest urban water removal situation can be obtained in time, which can be of great reference value. By analyzing the urban water accumulation effect map, the occurrence of urban waterlogging can be predicted in advance.
[0047] Among them, in practical application, pay attention to:
[0048] (1) When calculating the urban water volume, other water volumes such as domestic sewage and evaporation are not considered;
[0049] (2) Upstream water will have a significant impact on a city's pipe network drainage system and surface flow, resulting in a deviation in the amount of urban water accumulation. Since Hefei City is not a city near the Yangtze River, upstream water is not considered;
[0050] (3) The present invention does not consider sacrificing local areas to preserve administrative measures in economically developed areas;
[0051] (4) The daily rainfall in the present invention is based on the 24-hour continuous rainfall.

PUM

no PUM

Description & Claims & Application Information

We can also present the details of the Description, Claims and Application information to help users get a comprehensive understanding of the technical details of the patent, such as background art, summary of invention, brief description of drawings, description of embodiments, and other original content. On the other hand, users can also determine the specific scope of protection of the technology through the list of claims; as well as understand the changes in the life cycle of the technology with the presentation of the patent timeline. Login to view more.

Similar technology patents

Classification and recommendation of technical efficacy words

Why Eureka
Try Eureka