
Method for analyzing main influence factor of power grid equipment utilization rate

A technology of influencing factors and analysis methods, applied in the field of power systems, can solve problems such as equipment affecting the safe and stable operation of the power grid, lagging, and equipment capacity waste

Inactive Publication Date: 2018-04-24
STATE GRID ENERGY RES INST +3
View PDF4 Cites 11 Cited by
  • Summary
  • Abstract
  • Description
  • Claims
  • Application Information

AI Technical Summary

Problems solved by technology

[0003] In order to meet the demand-side power supply requirements and adapt to the future load increase rate, while ensuring the safety, stability, economy and other constraints of the power grid, it is necessary to make a reasonable assessment of the use of power grid equipment and grasp the utilization rate of existing equipment, so as to provide power for the power grid. Provide effective reference information and guidance suggestions for planning, design, operation scheduling, etc., to avoid excessively advanced power grid construction leading to generally low equipment utilization, resulting in waste of equipment capacity and reduced economic benefits of power grid enterprises, or grid construction lags behind load growth, making a large number of equipment in Heavy load or even overload operation will affect the safe and stable operation of the power grid
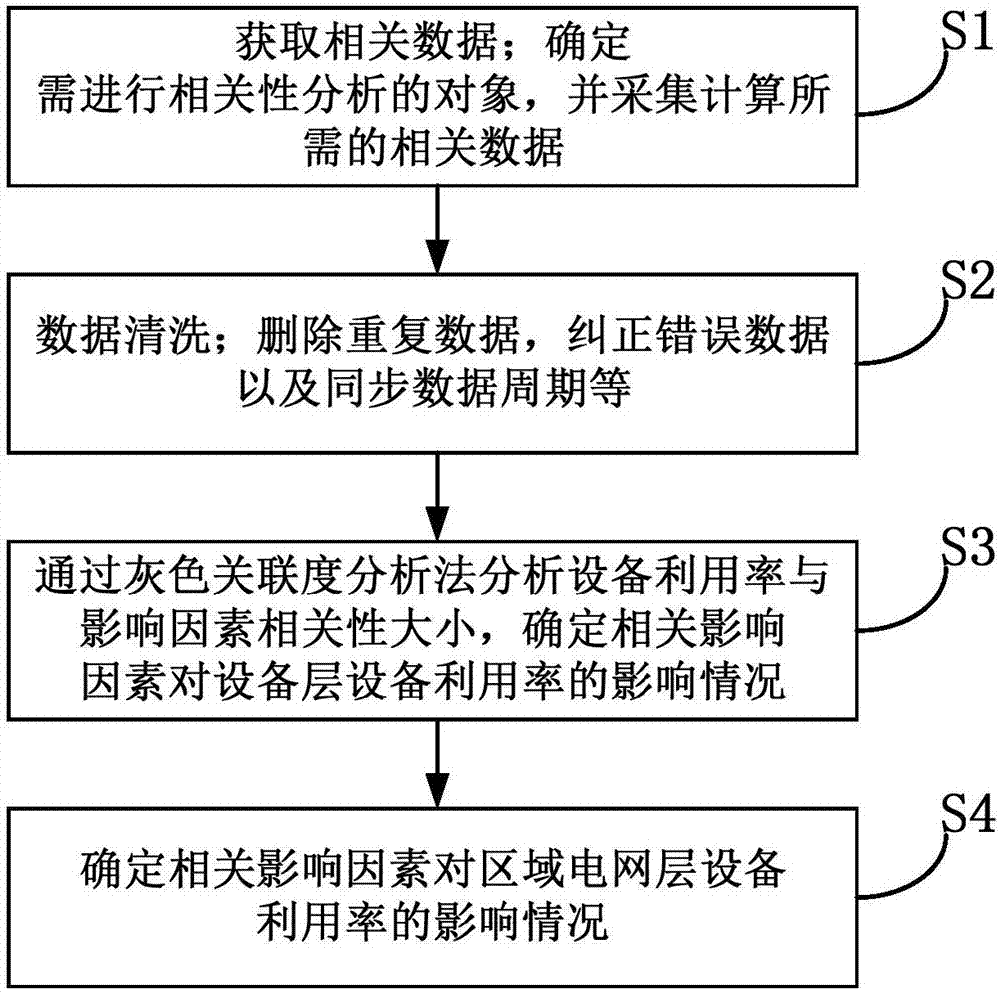
[0004] The calculation of the utilization rate of equipment at the traditional grid layer only stays in the calculation of the load of each equipment, that is, the utilization efficiency, without further excavating the reasons behind the utilization situation

Method used


Image

  • Method for analyzing main influence factor of power grid equipment utilization rate
  • Method for analyzing main influence factor of power grid equipment utilization rate
  • Method for analyzing main influence factor of power grid equipment utilization rate

Examples


Embodiment 1

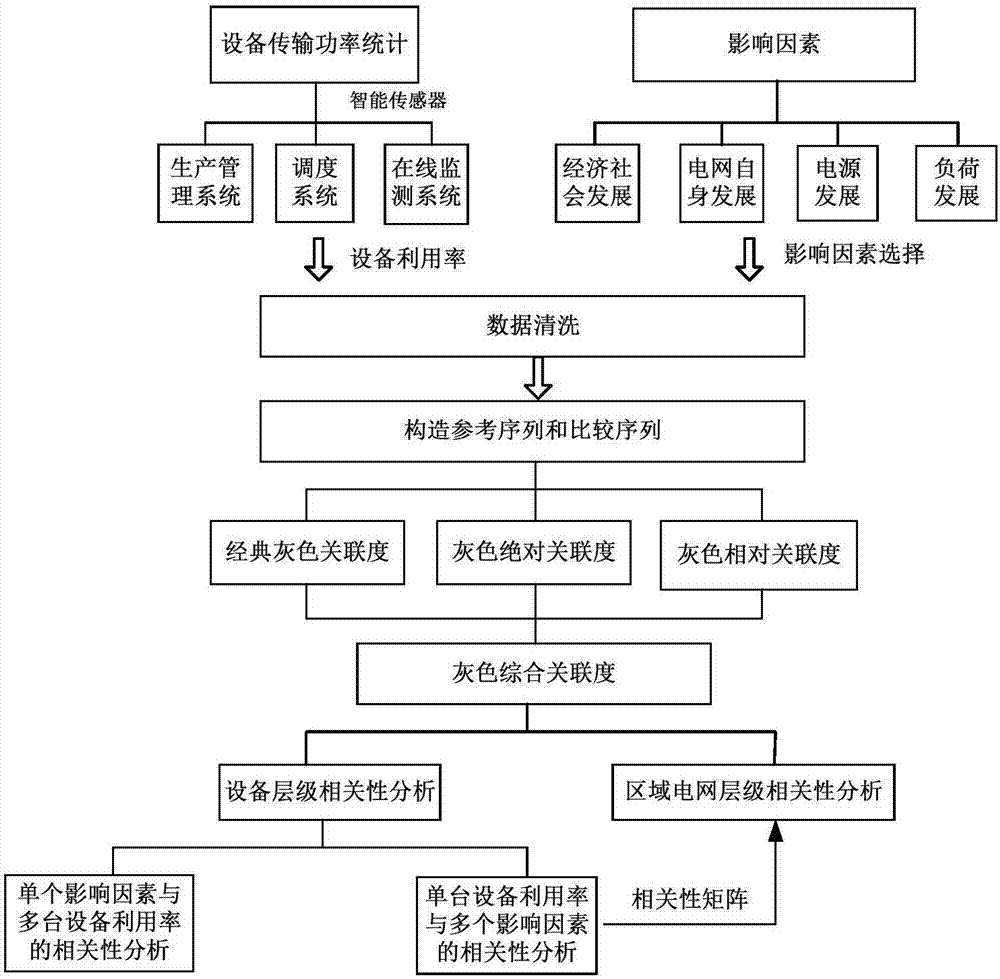
[0108] Correlation Analysis of Single Influencing Factor and Equipment Utilization Rate of Multiple Equipment

[0109]Selecting a certain influencing factor and performing correlation analysis on the equipment utilization of multiple equipment can determine the more prominent equipment affected by the influencing factor. Meteorological factors such as temperature have a direct impact on the load of residential users. They change the electric energy circulating in the power grid by affecting the load demand. Considering that the electrical positions of each device in the power grid are different, the load carried by the equipment has a direct impact on the temperature. The degree of sensitivity is also different. Under the operation mode of the power generation side arranged according to the economic output, the variation degree of the utilization rate of each equipment is also different. In other words, these influencing factors have a certain indirect impact on the equipment u...

Embodiment 2

[0150] Correlation analysis between the equipment utilization rate of a single equipment and multiple influencing factors.

[0151] The power delivered by the equipment is related to multiple influencing factors, including direct influencing factors such as load demand and power grid development stage, and indirect influencing factors such as economic development level, meteorological conditions, and population and environmental factors. Finding the main influencing factors that play a leading role among many influencing factors, and mining the controlling factors behind them through the appearance of equipment utilization data, will guide the equipment utilization to the expected development trend and achieve better power grid equipment asset management. meaning. The correlation analysis between the equipment utilization rate of a single equipment and multiple influencing factors specifically includes the following steps:

[0152] B11. Set a certain time interval; obtain the...


PUM


Abstract

The invention discloses a method for analyzing main influence factors of a power grid equipment utilization rate. The method comprises the following steps: acquiring related data, namely confirming atarget to be subjected to correlation analysis, and acquiring related data demanded by calculation; performing data cleaning, namely deleting repeated data, correcting wrong data, and synchronizing data cycles; analyzing correlation of an equipment utilization rate with an influence factor by using a gray relational analysis grade method, and confirming the influence of the related influence factor to an equipment layer equipment utilization rate; confirming the influence of a related influence factor to a power grid equipment utilization rate. Through analysis on power distribution grid equipment utilization data, hidden valuable information related to the utilization rate under utilization rate data distribution is explored by using a correlation analysis method, main factors influencingpower distribution grid equipment utilization rates are searched, certain improvement ways and ideas are provided to improve equipment utilization efficiency, and the system utilization rate can be maintained at a reasonable level.

Description

technical field [0001] The invention relates to the technical field of power systems, in particular to an analysis method for main factors affecting the utilization rate of power grid layer equipment. Background technique [0002] With the promotion and construction of smart grids in recent years and the gradual increase in power companies' emphasis on the quality and efficiency of power grid development, the utilization of power system assets has gradually become an issue that has attracted widespread attention. Among them, transmission and distribution lines and transformers are primary equipment mainly responsible for power transmission tasks, which involve high investment, and their utilization rate has a direct impact on the utilization efficiency of power system assets. Therefore, when conducting research on the utilization rate of power system assets , the research object selected by the present invention is power grid equipment mainly including power transmission and...

Claims


Application Information

Patent Timeline
Patent Type & Authority Applications(China)
IPC IPC(8): G06Q10/06G06Q50/06
CPCG06Q10/0639G06Q50/06
Inventor 张全韩新阳杨倩杨军靳晓凌王东张钧陈嵘曾沅王文华周建其钱伟杰郭外莺张风彬
Owner STATE GRID ENERGY RES INST
Learn More