Eureka AIR delivers breakthrough ideas for toughest innovation challenges, trusted by R&D personnel around the world.

Structural health monitoring abnormal data diagnosis method based on computer vision and deep learning technology

A computer vision and deep learning technology, applied in the fields of civil engineering structural health monitoring, machine learning, and signal processing, can solve the problems of inability to meet the accuracy and efficiency requirements of online early warning and structural state assessment, high cost, and low degree of automation. Improve efficiency and reliability, reduce manual participation, and facilitate the process

Active Publication Date: 2018-11-06
HARBIN INST OF TECH
View PDF4 Cites 16 Cited by
  • Summary
  • Abstract
  • Description
  • Claims
  • Application Information

AI Technical Summary

Problems solved by technology

[0004] The purpose of the present invention is to solve the existing single-objective methods such as compressed sensing and data distribution regression-based recovery of lost data, which are difficult to deal with situations with multiple abnormal patterns, and are prone to over-processing and under-processing problems, which cannot meet the requirements of online early warning and Due to the accuracy and efficiency requirements of structural state assessment, and the low degree of automation and high cost of manual expert intervention, a method for diagnosing abnormal data in structural health monitoring based on computer vision and deep learning technology is proposed

Method used


Image

  • Structural health monitoring abnormal data diagnosis method based on computer vision and deep learning technology
  • Structural health monitoring abnormal data diagnosis method based on computer vision and deep learning technology
  • Structural health monitoring abnormal data diagnosis method based on computer vision and deep learning technology

Examples


specific Embodiment approach 1

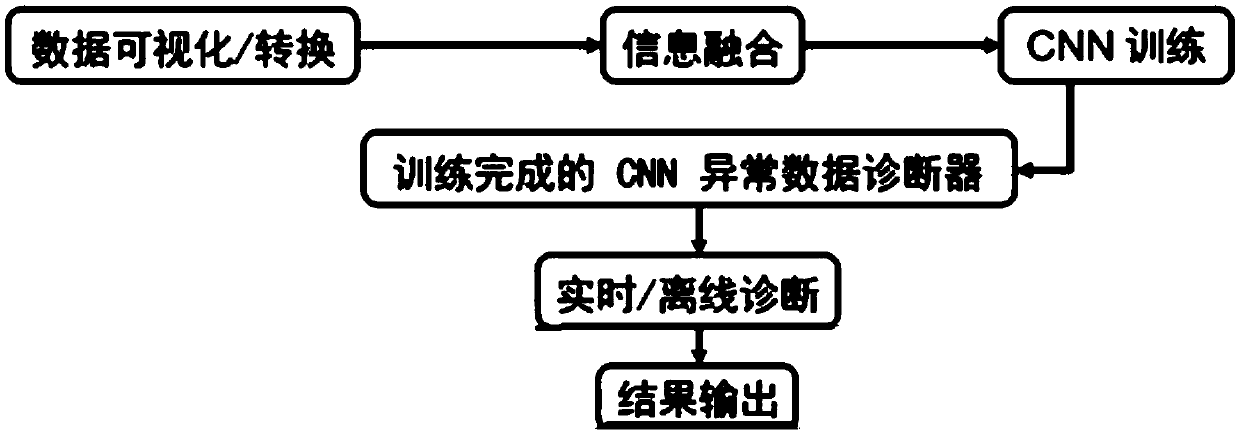
[0023] Specific implementation mode 1: The abnormal data diagnosis method of structural health monitoring based on computer vision and deep learning technology in this implementation mode, such as Figure 7 shown, including:

[0024] Step 1. Convert the monitoring data used for training from time series data to time domain response image data and frequency domain response image data through data visualization processing; according to the time domain response image data and frequency domain response image data corresponding to the same data segment Form a dual-channel time-frequency response diagram; select samples from the dual-channel time-frequency response diagram and mark the abnormal type of the sample to form a training set; data visualization is the process of turning data into visible curves and charts, such as in Figure 1(a) It is to convert time domain and frequency domain data into time domain and frequency domain images.

[0025] Step 2. Input the training set int...

specific Embodiment approach 2

[0031] Specific implementation mode two: the difference between this implementation mode and specific implementation mode one is that step one is specifically:

[0032] Step 11. Cut the monitoring data to be diagnosed into n data segments d according to the time interval w, and generate a data set D{d};

[0033] Step 12, draw the time-domain corresponding diagram and frequency-domain response diagram of each data segment d in the data set D respectively, and generate a dual-channel time-frequency response diagram p according to the time-domain corresponding diagram and frequency-domain response diagram of the same data segment, Form a data set D{d,p};

[0034] Step 13: Randomly select m picture samples p from D to form a training set S{p};

[0035] Step 14. In the training set S, evaluate the abnormal type of the sample p according to the time and frequency domain response characteristics, and label p with a label L;

[0036]Step 15. Repeat step 14 until all m samples in the...

specific Embodiment approach 3

[0039] Specific embodiment three: the difference between this embodiment and specific embodiment one or two is that in the time-frequency response graph p, the R channel is used to represent the time domain response graph, and the G channel is used to represent the frequency domain response graph, and the time domain response graph and the frequency domain Areas where the response plots overlap are set to black.

[0040] The parameters are the same as those in Embodiment 1 or 2.


PUM


Abstract

The invention provides a structural health monitoring abnormal data diagnosis method based on computer vision and deep learning technology, and aims at solving the problems of overtreatment and under-treatment due to the fact that the present method has difficulty to handle the situations with multiple abnormal patterns and the disadvantages of low degree of automation and high cost of manual expert intervention. The method comprises the steps that the monitoring data to be diagnosed are converted into the time domain response image data and the frequency domain response image data from the time sequent data through data visualization processing; a two-channel time-frequency response diagram is formed according to the time domain response image data and the frequency domain response imagedata corresponding to the same data segment; the samples are selected from the two-channel time-frequency response diagram and the abnormal type of the samples is marked so as to form a training set;the training set is inputted to a convolutional neural network model, and the trained model acts as the abnormal data diagnosis instrument; and the monitoring data to be diagnosed are inputted to theabnormal data diagnosis instrument so as to obtain the diagnosis result. The method is suitable for structural health data monitoring.

Description

technical field [0001] The invention relates to the technical fields of machine learning, signal processing, and civil engineering structural health monitoring, and in particular to a method for diagnosing abnormal data of structural health monitoring based on computer vision and deep learning technology. Background technique [0002] In today's civil engineering field, with the aging of many building structures and the construction of more and more large and complex infrastructures, Structural Health Monitoring (SHM), as an important tool for monitoring, management and maintenance, has been widely used in engineering Practice. The monitoring system can not only monitor the various responses of the structure in real time, provide a reference for the state assessment of the structure, but also provide a basis for the repair and maintenance of the structure. Its role is directly related to the safety and availability of the structure. Since the initial application of structu...

Claims


Application Information

Patent Timeline
Patent Type & Authority Applications(China)
IPC IPC(8): G06Q10/06G06Q50/08G06N3/04
CPCG06Q10/0639G06Q50/08G06N3/045
Inventor 鲍跃全李惠唐志一
Owner HARBIN INST OF TECH
Why Eureka
Eureka Blog
Learn More