A method for predicting field operation and maintenance faults of electric pow communication
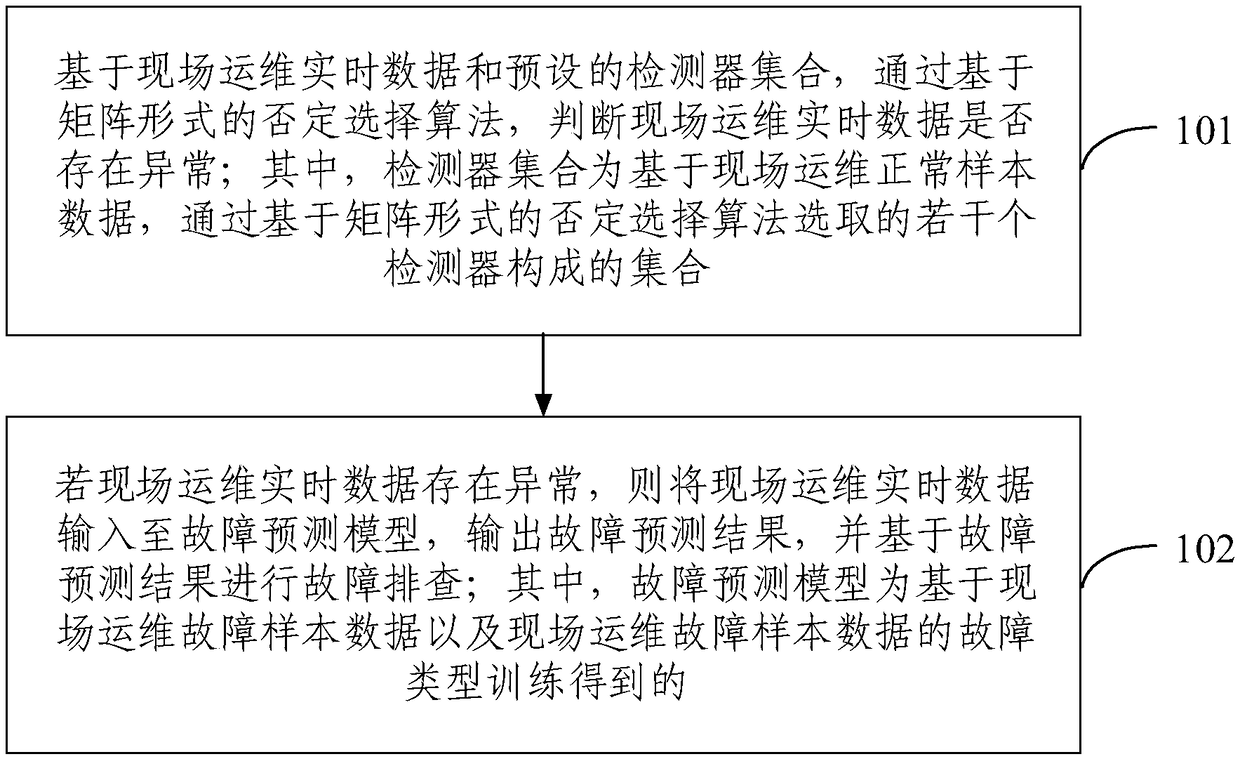
A fault prediction and power communication technology, applied in prediction, data processing applications, instruments, etc., can solve problems such as false alarms, low prediction efficiency, and large data volume, and achieve the effect of reducing performance requirements, improving prediction efficiency and prediction accuracy.
- Summary
- Abstract
- Description
- Claims
- Application Information
AI Technical Summary
Problems solved by technology
Method used
Image
Examples
example 1
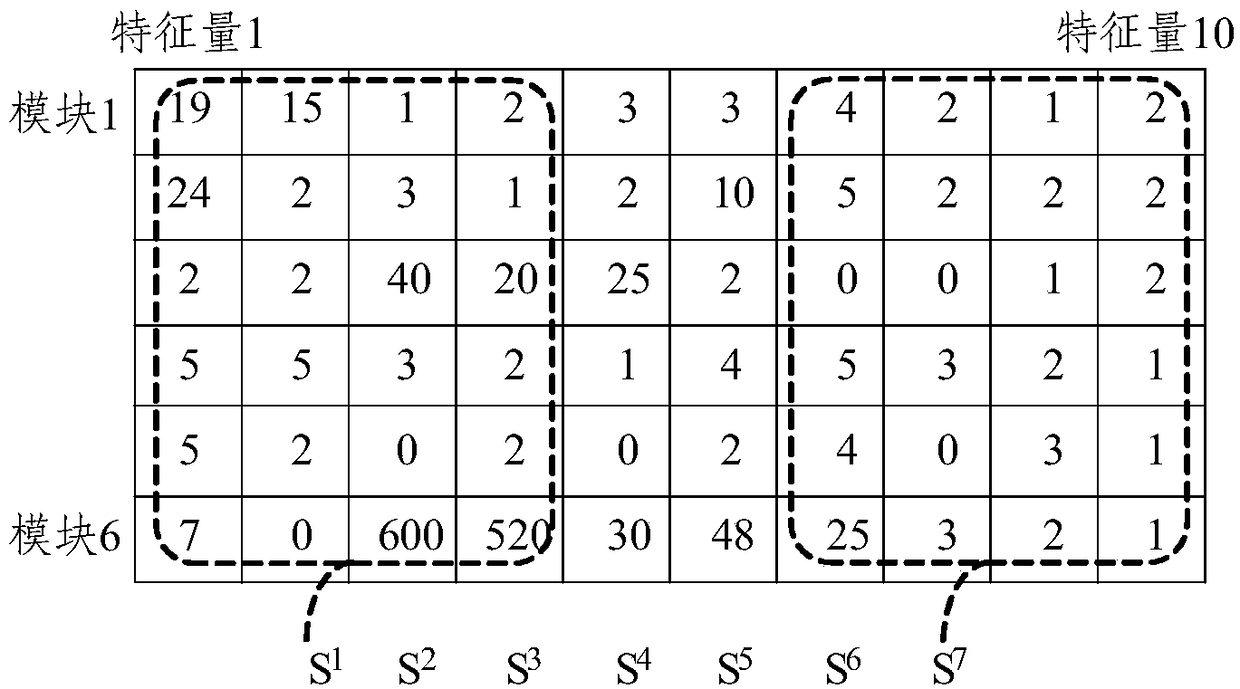
[0091] Figure 4 It is a schematic flow chart of a power communication field operation and maintenance fault prediction method according to an embodiment of the present invention, refer to Figure 4 , before judging whether the real-time data of on-site operation and maintenance is abnormal, first, select the sample data of m modules from the normal sample data of on-site operation and maintenance, and encode the sample data of the above m modules into y real-valued vectors . The modules here can be selected from communication cable line data, communication optical cable line data, communication optical transmission equipment data, communication microwave equipment data, communication carrier equipment data and communication power supply equipment data.
[0092] Second, select the parameter n, combine n consecutive vectors into an m×n matrix, and form the self-set S with y-n+1 matrices obtained.
[0093] Then, the detectors are generated by the detector generation algorithm ...
example 2
[0098] Collect the data of 6 modules, encode them into 10 real-valued vectors, take n=4, form a 6×4 matrix, the number is 7, and generate 100 detectors to form a detector set D. Periodically take 200 on-site operation and maintenance data as the data to be tested. Through simulation, the percentage of detectors with different thresholds among the detectors generated by applying the dynamic threshold negative selection algorithm, and the change of the detection rate of abnormal data in the negative selection algorithm under different thresholds are obtained.
[0099] Figure 5 It is a schematic diagram of the proportion of detectors with different thresholds among the detectors generated by the dynamic threshold negative selection algorithm according to the embodiment of the present invention, Figure 6 It is a schematic diagram of the detection rate of abnormal data in the negative selection algorithm under different thresholds in the embodiment of the present invention, whic...
PUM
 Abstract
Description
Claims
Application Information
 - R&D
- Intellectual Property
- Life Sciences
- Materials
- Tech Scout
- Unparalleled Data Quality
- Higher Quality Content
- 60% Fewer Hallucinations
Browse by: Latest US Patents, China's latest patents, Technical Efficacy Thesaurus, Application Domain, Technology Topic, Popular Technical Reports.
© 2025 PatSnap. All rights reserved.Legal|Privacy policy|Modern Slavery Act Transparency Statement|Sitemap|About US| Contact US: help@patsnap.com


