Method for measuring glycosylated hemoglobin, and device for measuring glycosylated hemoglobin

A technology of glycosylated hemoglobin and hemoglobin, applied in the field of glycosylated hemoglobin, which can solve problems such as difficult to reflect symptoms

Active Publication Date: 2018-12-21
TOSOH CORP
View PDF2 Cites 5 Cited by
  • Summary
  • Abstract
  • Description
  • Claims
  • Application Information

AI Technical Summary

Problems solved by technology

Furthermore, it has been reported in recent years (Non-Patent Documents 1 to 3) that, although rare, blood samples to be measured for glycosylated hemoglobin contain various abnormal hemoglobins produced as a result of the above-mentioned gene mutations. In the chromatographic measurement method, measurement results reflecting

Method used


Image

  • Method for measuring glycosylated hemoglobin, and device for measuring glycosylated hemoglobin
  • Method for measuring glycosylated hemoglobin, and device for measuring glycosylated hemoglobin
  • Method for measuring glycosylated hemoglobin, and device for measuring glycosylated hemoglobin

Examples


Embodiment 1

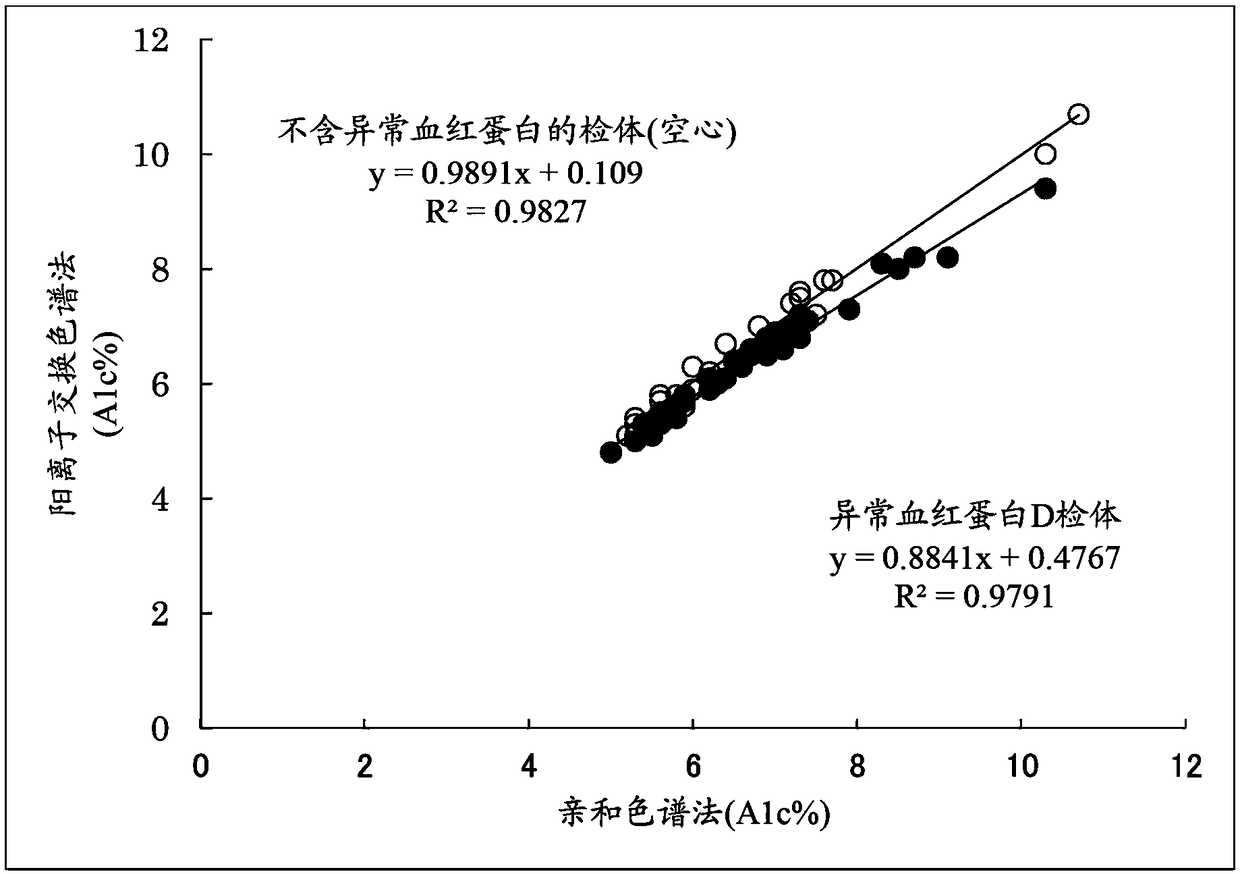
[0111] For blood samples containing abnormal hemoglobin D, the following method of the present invention was implemented: in the chromatogram obtained by cation exchange chromatography ( Figure 5 ), calculate the total peak area (Total area) of the chromatogram and the peak areas of A1a, A1b, HbF, LA1c, sA1c, A', H-V0, and obtain the X1c area according to the formula (3), according to the formula ( 2) Determine the area of ​​A0, and calculate A1c% according to formula (1). It should be noted that the peak detection range of H-V0 is 1.00±0.07 minutes.

[0112] (1) Peak area of ​​A'

[0113] Calculate the peak area of ​​A' according to the chromatogram to be 921.2.

[0114] (2) Peak area of ​​α

[0115] According to the chromatogram, the peak area of ​​α was calculated to be 8.0+6.7+38.1+63.9=116.7.

[0116] (3) Peak area of ​​sA1c

[0117] According to the chromatogram, the peak area of ​​sA1c was calculated to be 63.9.

[0118] (4) Peak area of ​​X0

[0119] Calculate t...

Embodiment 2

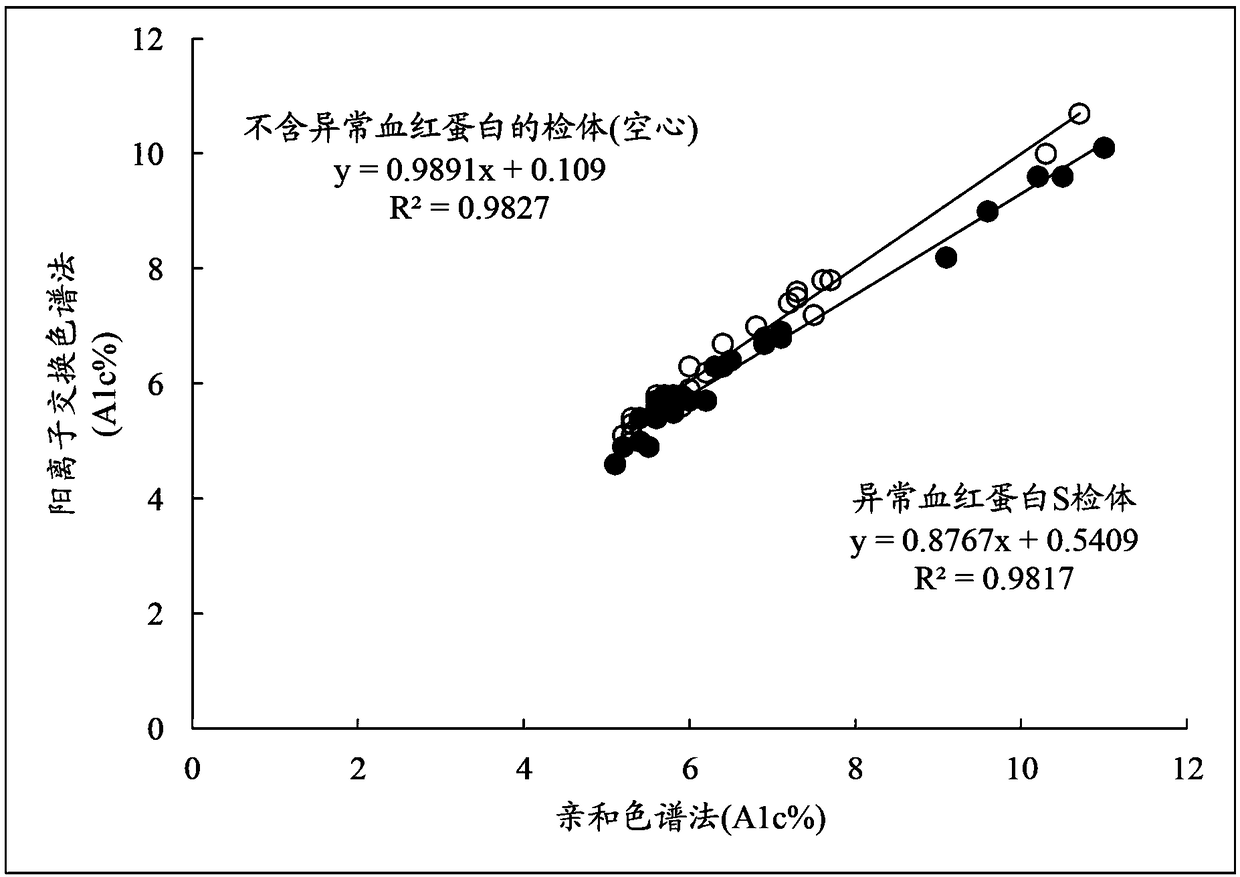
[0131] For blood samples containing abnormal hemoglobin S, the following method of the present invention was implemented: in the chromatogram obtained by cation exchange chromatography ( Image 6 ), calculate the total peak area (Total area) of the chromatogram and each peak area of ​​A1a, A1b, HbF, LA1c, sA1c, A', H-V1, and obtain the X1c area according to the formula (3), according to the formula ( 2) Determine the area of ​​A0, and calculate A1c% according to formula (1). It should be noted that the peak detection range of H-V1 is 1.16±0.09 minutes.

[0132] (1) Peak area of ​​A'

[0133] Calculate the peak area of ​​A' according to the chromatogram to be 899.0.

[0134] (2) Peak area of ​​α

[0135] According to the chromatogram, the peak area of ​​α was calculated to be 11.8+7.8+31.4+78.6=129.6.

[0136] (3) Peak area of ​​sA1c

[0137] According to the chromatogram, the peak area of ​​sA1c was calculated to be 78.6.

[0138] (4) Peak area of ​​X0

[0139] Calculat...

Embodiment 3

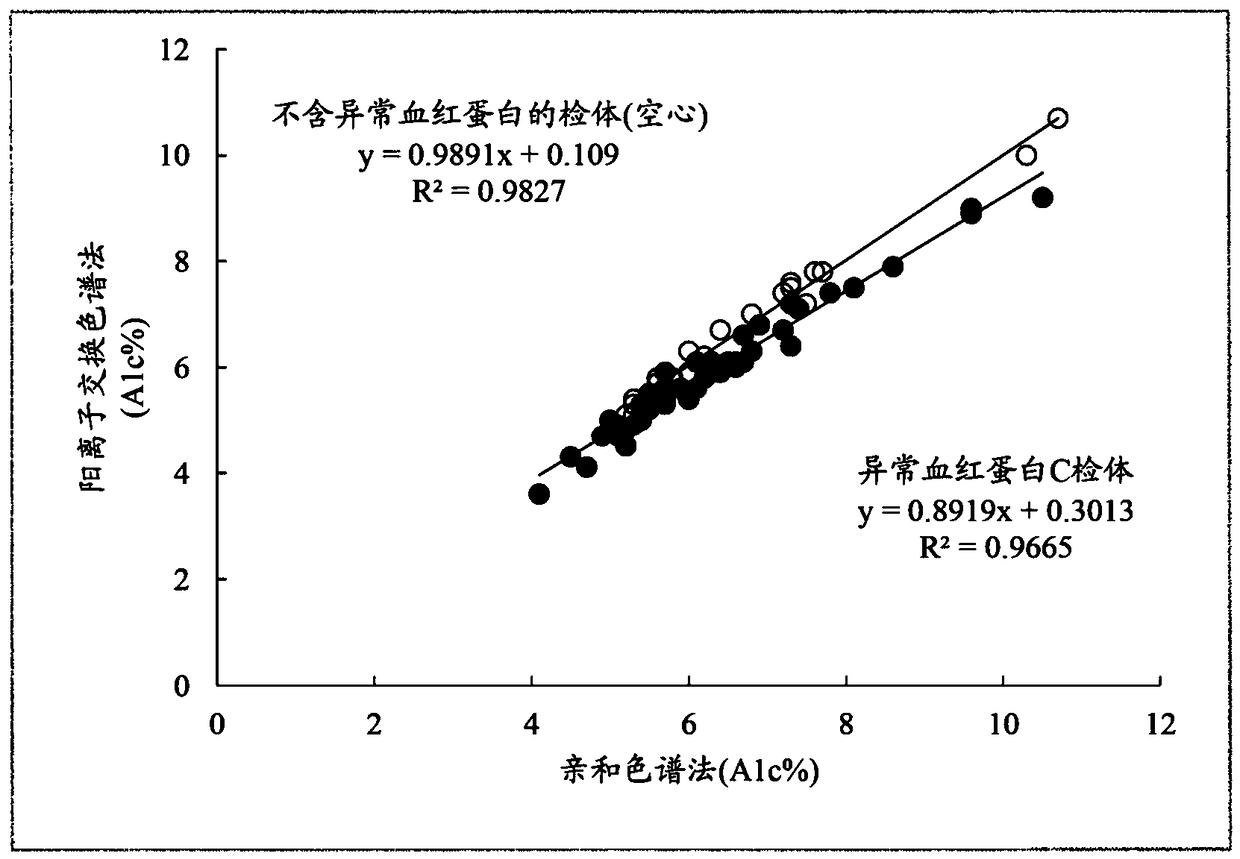
[0151] For blood samples containing abnormal hemoglobin C, the following method of the present invention was implemented: in the chromatogram obtained by cation exchange chromatography ( Figure 7 ), calculate the peak areas of A1a, A1b, LA1c, sA1c, and A0, and calculate A1c% according to formula (4). It should be noted that the peak detection range of H-V2 is 1.34±0.09 minutes.

[0152] (1) Peak area of ​​A0

[0153] According to the chromatogram, the peak area of ​​A0 was calculated to be 1140.3.

[0154] (2) Peak area of ​​α

[0155] According to the chromatogram, the peak area of ​​α was calculated to be 10.8+11.8+34.8+89.9=147.3.

[0156] (3) Peak area of ​​sA1c

[0157] According to the chromatogram, the peak area of ​​sA1c was calculated to be 89.9.

[0158] (8) Calculation of A1c%

[0159] Substituting the numerical value obtained above into formula (4), A1c%=6.7% was calculated.

[0160] (9) Converted to NGSP value (conversion factors 1.1151, 0.6558)

[0161] ...


PUM


Abstract

The purpose of the present invention is to eliminate the effect of abnormal hemoglobin when a blood sample containing abnormal hemoglobin D, abnormal hemoglobin S, or abnormal hemoglobin C is measuredby cation exchange chromatography, and to obtain an sA1c measurement result reflecting a symptom of the test subject providing the blood sample. The abovementioned problem is solved by a method for measuring the ratio (%) of sA1c, characterized by comprising calculating the area of the peak when a peak originating from abnormal hemoglobin D, abnormal hemoglobin S, or abnormal hemoglobin C is identified and measuring the ratio (%) of sA1c corrected using the calculation result.

Description

technical field [0001] The present invention relates to a method and device for measuring glycated hemoglobin in a blood sample by liquid chromatography, and more particularly to a glycated hemoglobin capable of measuring glycated hemoglobin as a diagnostic index for diabetes in a blood sample group in which blood samples containing abnormal hemoglobin may be mixed measuring method and measuring device. Background technique [0002] Hemoglobin has an α2β2 structure consisting of 2 α chains and 2 β chains. In addition to hemoglobin A, which accounts for about 97% of the total hemoglobin, it is composed of hemoglobin F and hemoglobin A2. The hemoglobin F has 2 α chains and 2 The α2γ2 structure composed of γ chains accounts for less than 1% of the total hemoglobin, and the hemoglobin A2 has an α2δ2 structure composed of two α chains and two δ chains and accounts for less than 1% of the total hemoglobin. [0003] Hemoglobin non-enzymatically combines with sugar (blood sugar) pr...

Claims


Application Information

Patent Timeline
IPC IPC(8): G01N30/88G01N30/02G01N30/86G01N33/49
CPCG01N2030/8822G01N30/8679G01N30/88B01D15/362G01N33/49G01N30/02G01N30/86G01N33/723G01N30/8631G01N30/8637
Inventor 长谷川幸行
Owner TOSOH CORP
Why Eureka
Try Eureka