
A Semantic Enhanced Large-Scale Multivariate Graph Simplified Visualization Approach

A large-scale and diverse technology, applied in the field of graph visualization, can solve problems such as inability to deeply explore network characteristics, difficult to fully utilize the multi-dimensional attribute information of network nodes, and inability to help users to associate the topology and multi-dimensional attributes semantically, so as to improve the exploration and performance. Cognitive Efficiency, Simplified Visual Expression, Reduced Effects of Visual Disorders

Active Publication Date: 2021-06-29
ZHEJIANG UNIV OF FINANCE & ECONOMICS
View PDF5 Cites 0 Cited by
  • Summary
  • Abstract
  • Description
  • Claims
  • Application Information

AI Technical Summary

Problems solved by technology

However, traditional simplified visualization methods for large-scale network graphs are difficult to make full use of the multi-dimensional attribute information of network nodes and extract effective semantic knowledge, thus failing to help users better understand the semantic relationship between topology and multi-dimensional attributes, and cannot deeply explore network characteristics. Wait

Method used


Image

  • A Semantic Enhanced Large-Scale Multivariate Graph Simplified Visualization Approach
  • A Semantic Enhanced Large-Scale Multivariate Graph Simplified Visualization Approach
  • A Semantic Enhanced Large-Scale Multivariate Graph Simplified Visualization Approach

Examples


Embodiment Construction

[0023] The method for simplified visualization of large-scale multivariate graphs with semantic enhancement in the present invention will be described in detail below in conjunction with the accompanying drawings, specifically including the following steps:

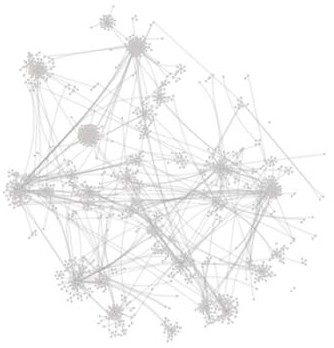
[0024] (1) Build a large-scale multivariate graph (such as figure 1 As shown), on the basis of the graph clustering algorithm based on modularity, the hierarchical structure of large-scale multivariate graphs is extracted by using the Blondel algorithm, a graph clustering detection algorithm based on modularity optimization, based on the different attributes of nodes as the division standard.

[0025] (2) As a preferred embodiment of the present invention, the optimal attribute value of each community can be marked. The optimal attribute value can be marked as follows: set two thresholds ε1 and ε2 (0.0<ε1<ε2). ε1 is used to judge whether the degree of aggregation of an attribute is too high on a large-scale multivariate ...


PUM


Abstract

The invention discloses a simplified visualization method for a large-scale multivariate graph with enhanced semantics, including: establishing a large-scale multivariate graph, extracting the hierarchical structure of the large-scale multivariate graph; utilizing the attributes of the large-scale multivariate graph, and constructing it according to the hierarchical structure of the large-scale multivariate graph A multi-scale community set, the attributes of the large-scale multivariate graph include modularity and multi-dimensional attribute information entropy; construct a multi-level force-guided layout for the multi-scale community set according to the hierarchical structure of the large-scale multivariate graph, and display the semantics of the community through mapping Expression; using the mapped and displayed communities to obtain a hierarchical view and an attribute Sankey view, and using the multilevel force-guided layout, hierarchical view, and attribute Sankey view to perform visual analysis on the large-scale multivariate graph. The invention can effectively simplify the visual expression of large-scale multivariate graphs, can quickly analyze the association structure and semantic composition of large-scale multivariate graphs in different application fields, and has strong practicability.

Description

technical field [0001] The invention relates to a simplified visual analysis method for a large-scale multivariate graph, belonging to the graph visualization field. Background technique [0002] Network graph visualization can effectively display the connection relationship between network nodes, and is widely used in many fields, such as social networks, knowledge graphs, biological gene networks, etc. As the scale of network data continues to increase, how to simplify and express large-scale network graph structures has become a research hotspot in the field of graph visualization. Classic network graph simplification visualization methods mainly include technologies such as graph sampling, edge binding, and graph clustering. On the basis of reducing the visual disorder caused by a large number of intersections of points and lines, it improves the efficiency of users' exploration and cognition of large-scale network structures. However, the above methods mainly focus on ...

Claims


Application Information

Patent Timeline
Patent Type & Authority Patents(China)
IPC IPC(8): G06F16/901G06F16/9536G06Q50/00
Inventor 周志光
Owner ZHEJIANG UNIV OF FINANCE & ECONOMICS
Learn More