Visualization method and device for continuous delivery, and server
A continuous delivery and successful technology, applied in the computer field, can solve problems such as lack of process visualization, inability to grasp product quality in real time, affecting R&D efficiency and software delivery quality, and achieve the effect of improving R&D efficiency, ensuring software delivery quality, and real-time deployment.
- Summary
- Abstract
- Description
- Claims
- Application Information
AI Technical Summary
Problems solved by technology
Method used
Image
Examples
Embodiment 1
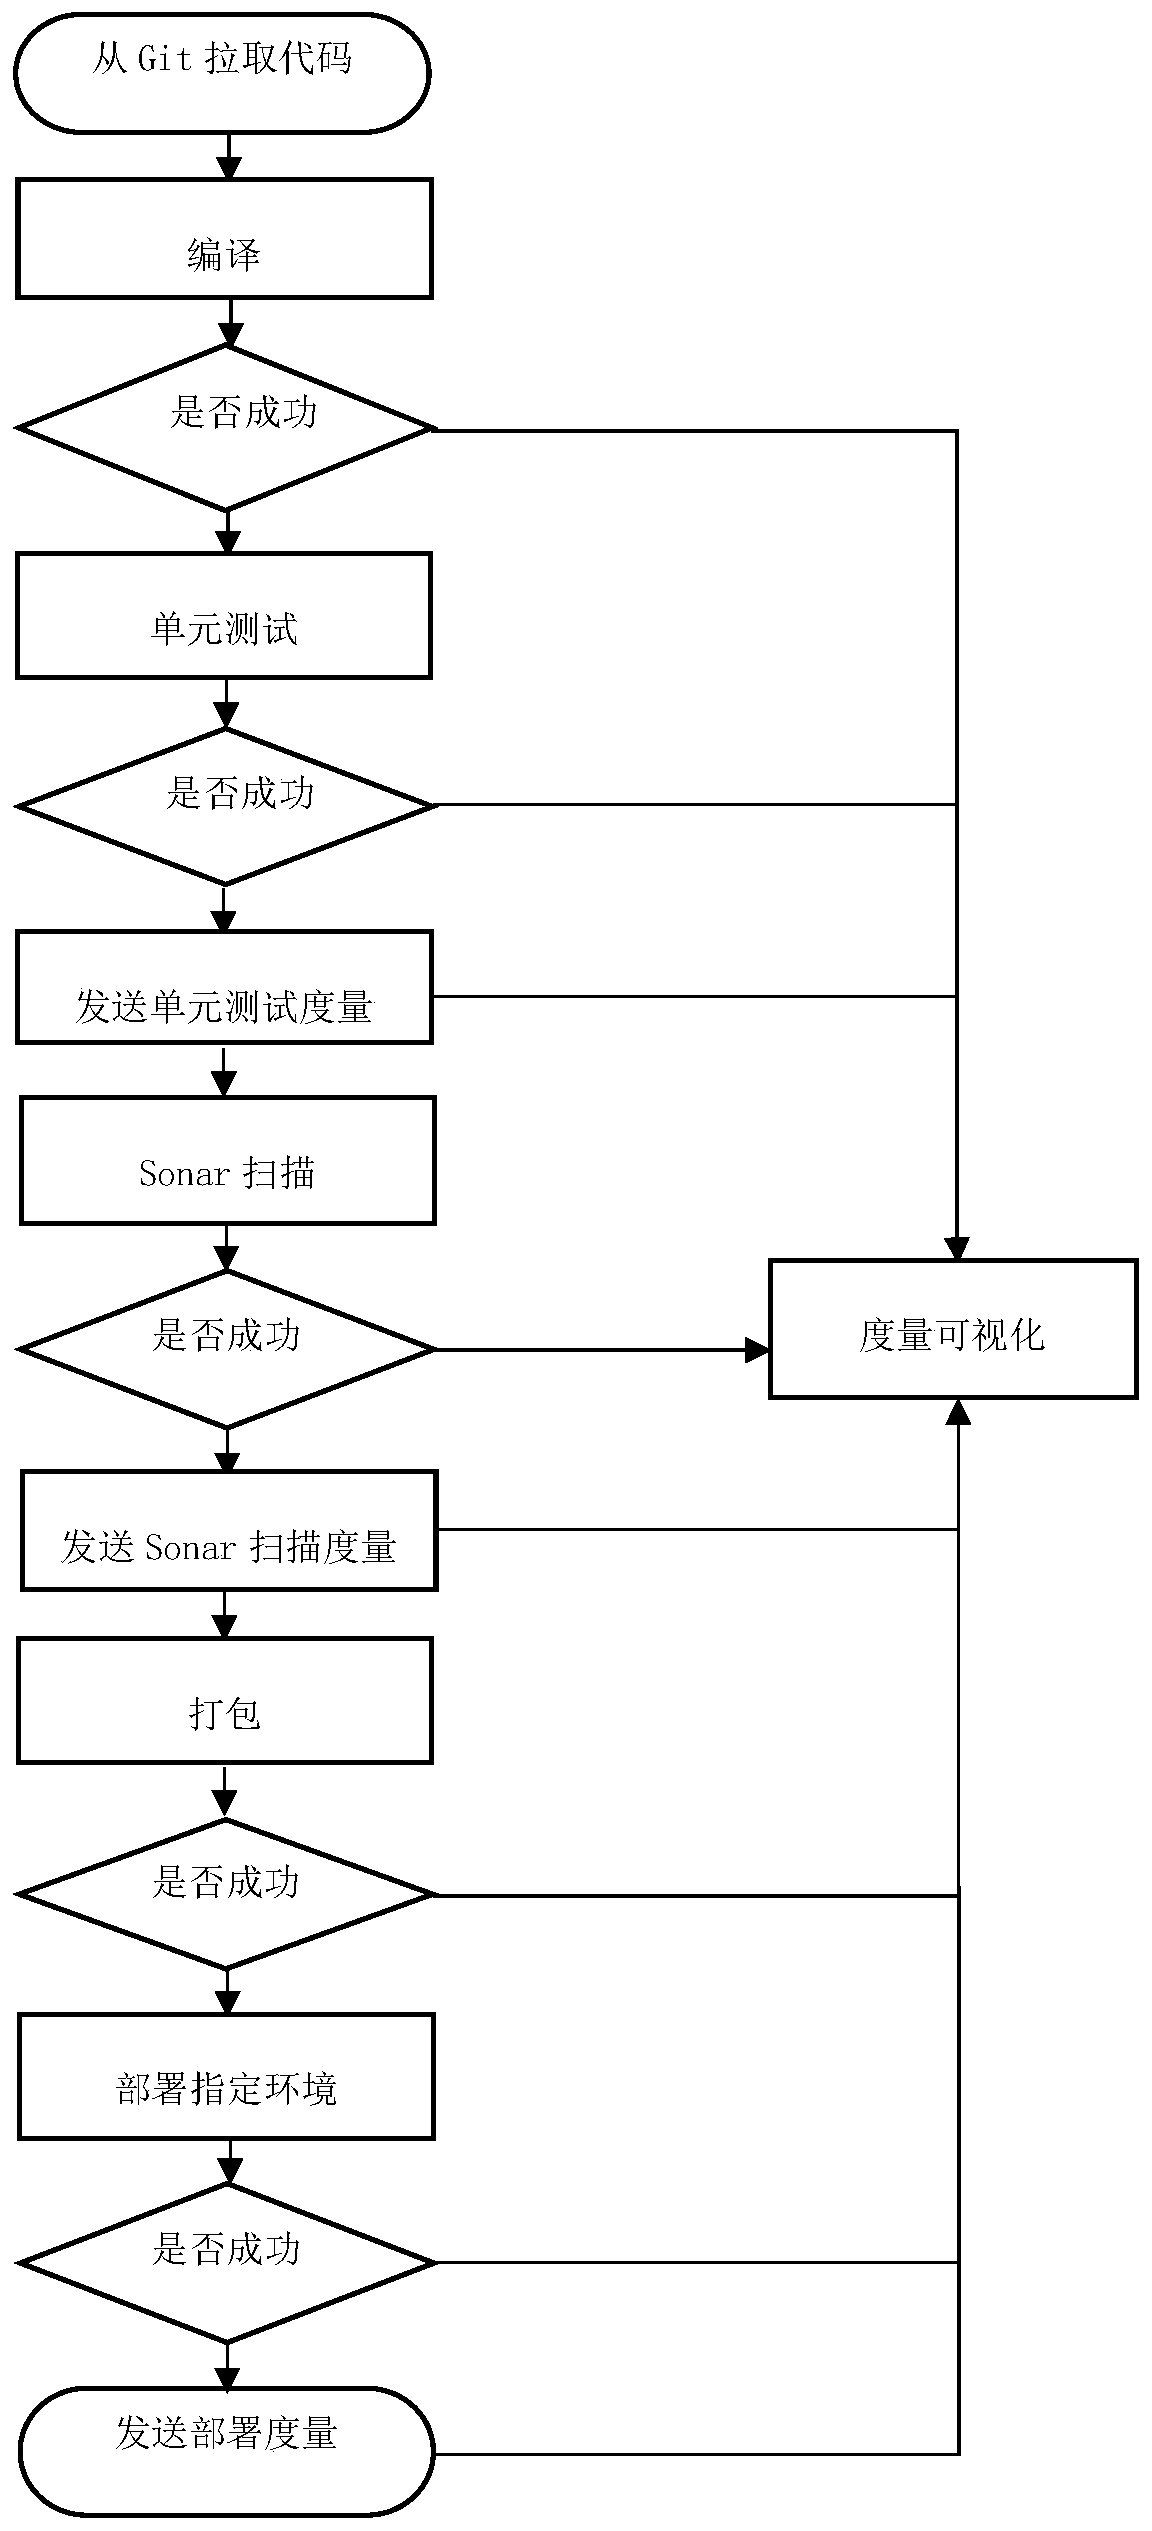
[0049] In view of the fact that the current continuous delivery lacks a visual display of the entire process, it is impossible to grasp the problems and product quality of the entire continuous delivery in real time, and to visually display the problems, which affects the efficiency of research and development, a method for continuous delivery is proposed. The visualization method of delivery, the visualization method is applied on the server side, the Jenkins continuous integration tool is installed on the server side, the GIT hook script is configured, the Jenkins is configured to execute the job of code compilation, and then the construction and purchase operation Groovy Postbuild is added to the Job configuration; a new Jenkins is created View, select Build MonitorView and set the view name; select Jenkins, Job that uses Groovy Postbuild, and add it to the BuildMonitor view. Open the Build Monitor view, check Show badges in the settings and save.
[0050] Such as figure 1...
Embodiment 2
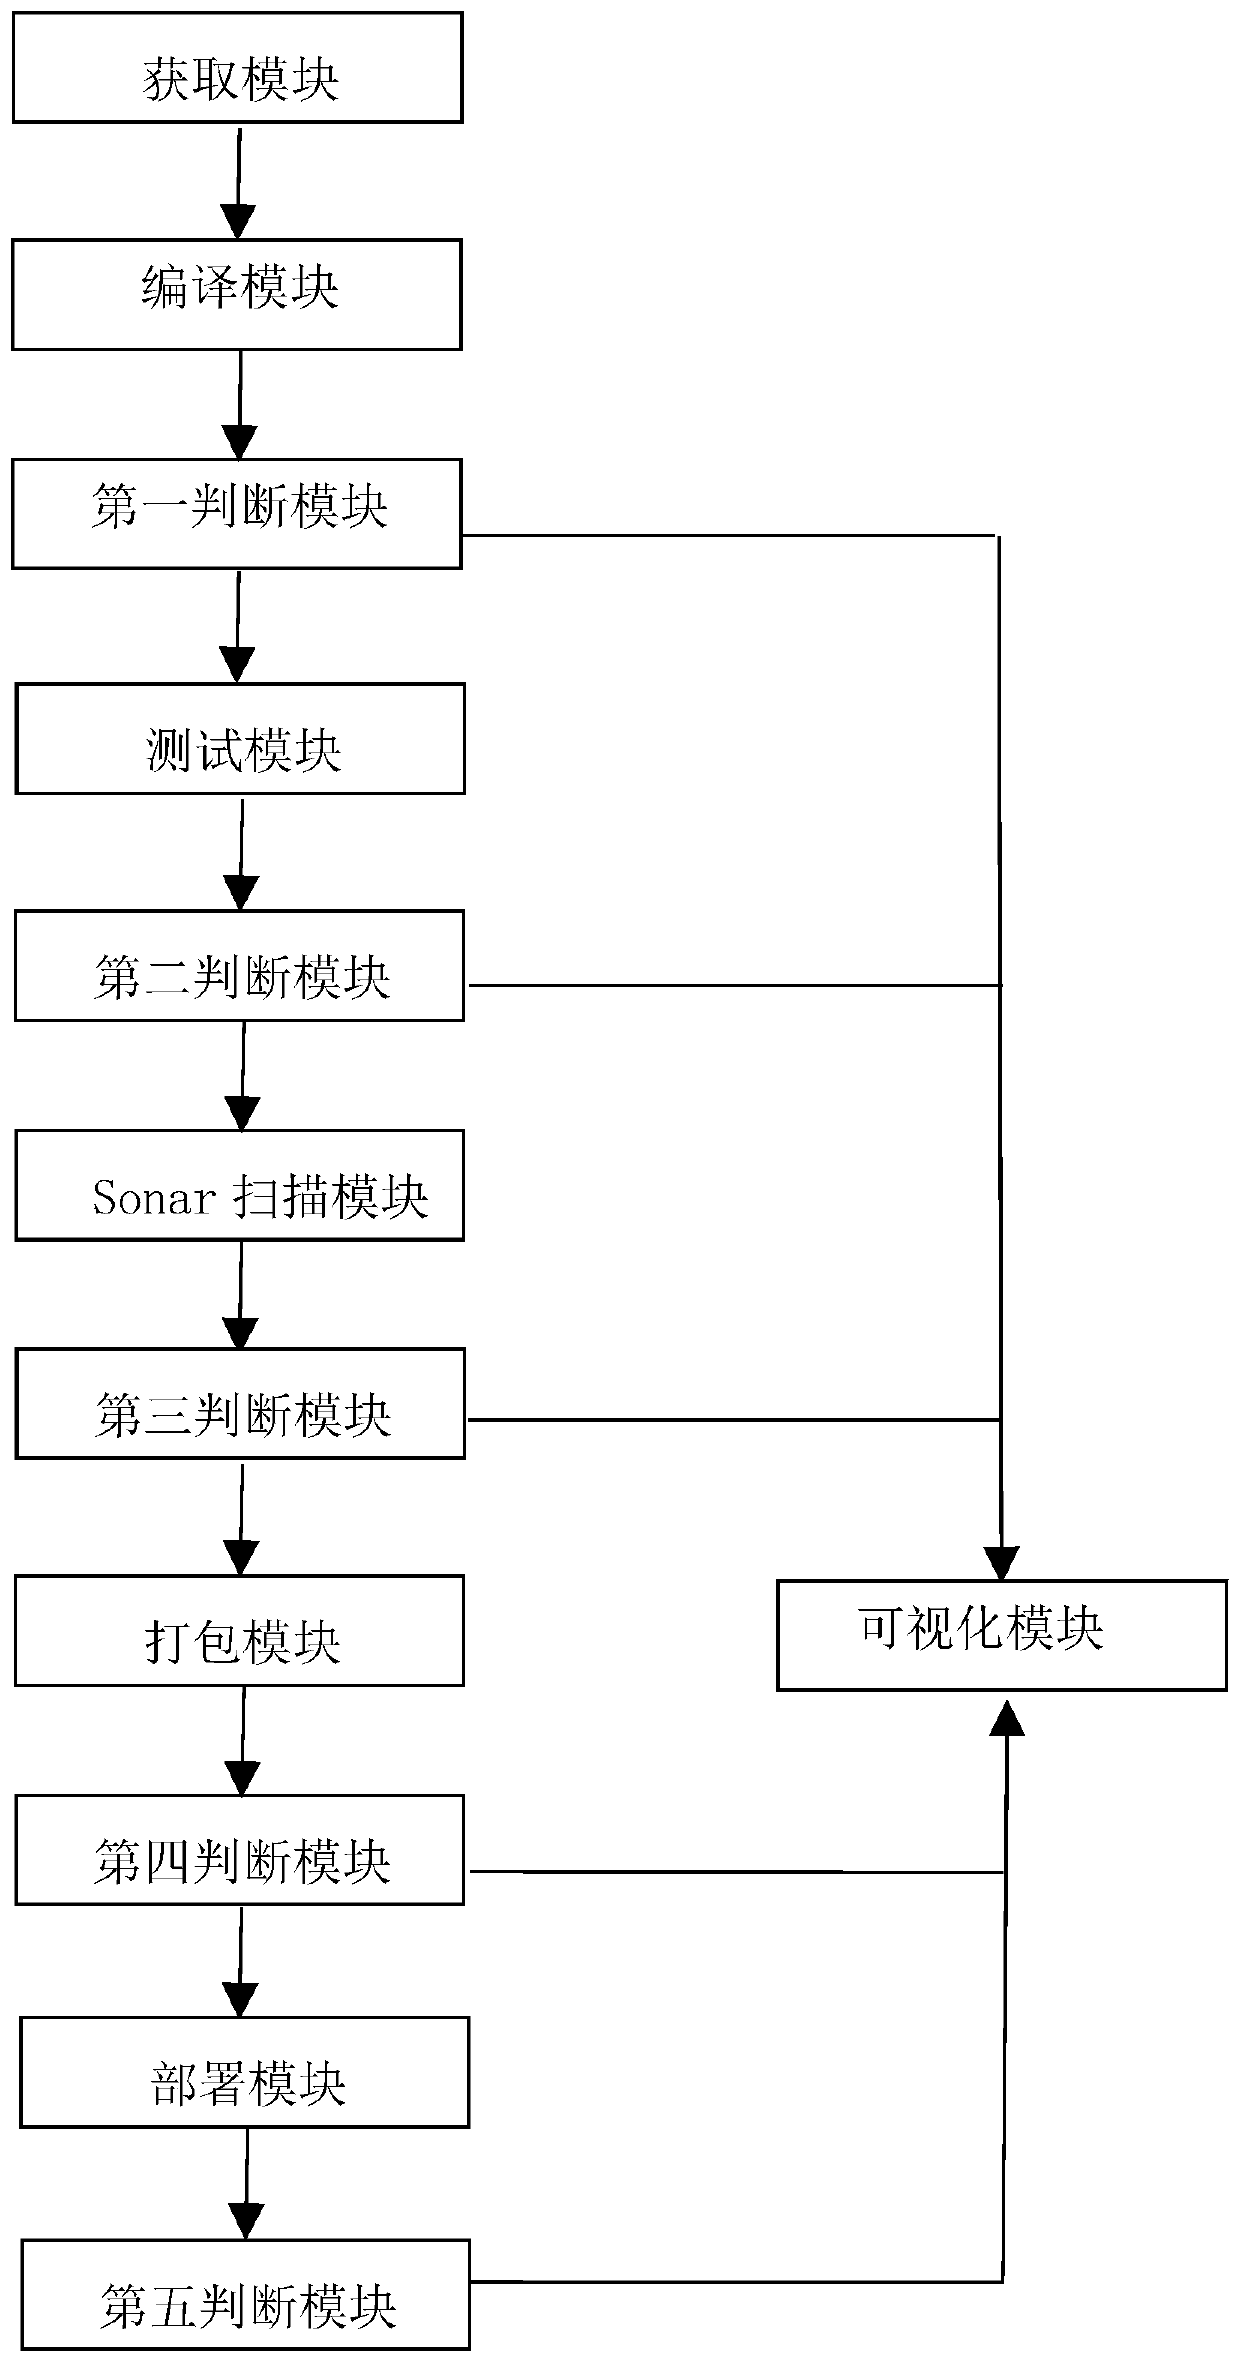
[0067] Corresponding to Embodiment 1, this embodiment provides a continuous delivery measurement visualization device, such as figure 2 As shown, the device:
[0068] Get the module, used to get the project source code;
[0069] A compiling module, configured to compile the project source code;
[0070] The first judging module is used to judge whether the compilation is successful. If the compilation is successful, the compiled code is sent to the test module; if the compilation fails, the compilation failure status is sent to the visualization module;
[0071] The test module is used to unit test the compiled code;
[0072] The second judgment module is used to judge whether the test is successful. If the test is successful, the test result and the test success status are sent to the visualization module, and the code of the test success is sent to the Sonar scanning module; if the test fails, the test failure status is sent. sent to the visualization module;
[0073] T...
Embodiment 3
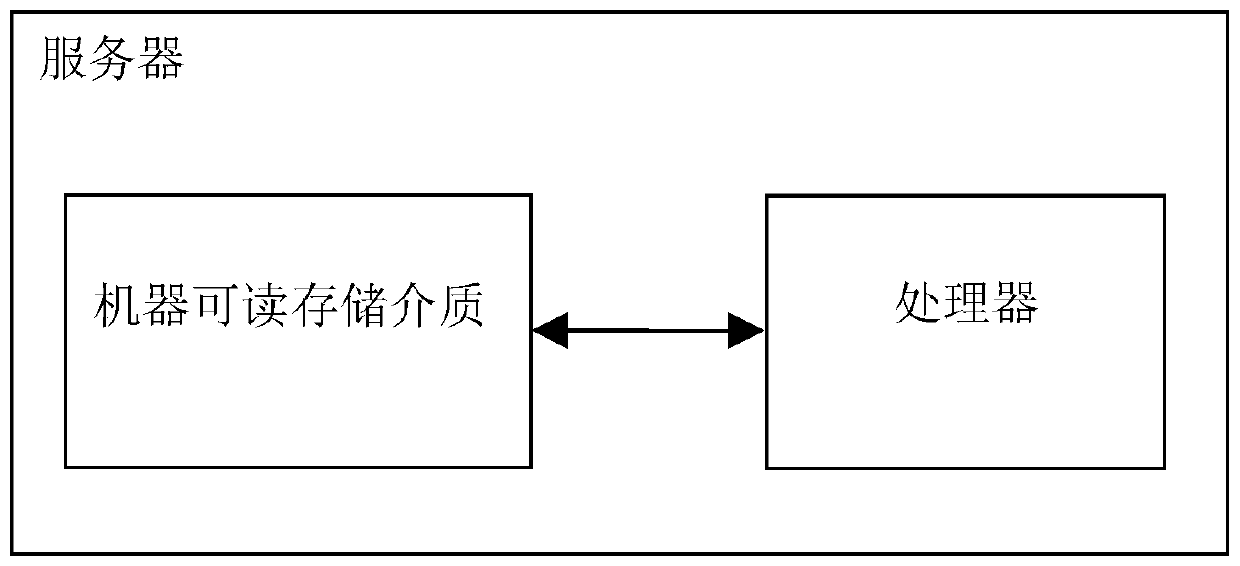
[0085] This embodiment provides a server, such as image 3 As shown, it includes a processor and a machine-readable storage medium, the machine-readable storage medium stores machine-executable instructions that can be executed by the processor, and when the processor executes the machine-executable instructions, the following step:
[0086] Get the project source code;
[0087] Compile the project source code;
[0088] Judging whether the compilation is successful, if the compilation is successful, enter the next step; if the compilation fails, visualize the compilation failure status and end;
[0089] Unit test the successfully compiled code;
[0090] Judging whether the test is successful, if the test is successful, visually display the test result and test success status in different forms, and enter the next step; if the test fails, visually display the test failure status, and end;
[0091] Sonar scans the successfully tested code;
[0092] Judging whether the scan ...
PUM
 Abstract
Description
Claims
Application Information
 - R&D
- Intellectual Property
- Life Sciences
- Materials
- Tech Scout
- Unparalleled Data Quality
- Higher Quality Content
- 60% Fewer Hallucinations
Browse by: Latest US Patents, China's latest patents, Technical Efficacy Thesaurus, Application Domain, Technology Topic, Popular Technical Reports.
© 2025 PatSnap. All rights reserved.Legal|Privacy policy|Modern Slavery Act Transparency Statement|Sitemap|About US| Contact US: help@patsnap.com


