High-precision indicator diagram production correction statistical method

A statistical method and high-precision technology, applied in computing, instrumentation, data processing applications, etc., can solve problems such as large errors and achieve high precision and wide adaptability

Inactive Publication Date: 2019-07-26
陕西安控科技有限公司
View PDF9 Cites 0 Cited by
  • Summary
  • Abstract
  • Description
  • Claims
  • Application Information

AI Technical Summary

Problems solved by technology

Most of the existing daily production statistics use the average method, that is, it is considered that the output of each work map can represent its daily output on the day, and the average daily production is obtained by averaging the liquid production of all work pictures on the day. Although this method calculates Simple, but the error is large, especially for oil wells with complex and changing working conditions

Method used


Image

  • High-precision indicator diagram production correction statistical method
  • High-precision indicator diagram production correction statistical method
  • High-precision indicator diagram production correction statistical method

Examples


Embodiment 1

[0041] According to the high-precision work diagram calculation correction statistical method of the present invention, by counting the operation time of the oil well; then extract all the work diagrams within the operation time of the oil well; remove the abnormal work diagrams from all the work diagrams during the operation time of the oil well to obtain the remaining work Figure; determine the effective operation time of the oil well corresponding to the remaining work map; summarize the production corresponding to each period of the effective operation time, that is, complete the high-precision work map production statistics.

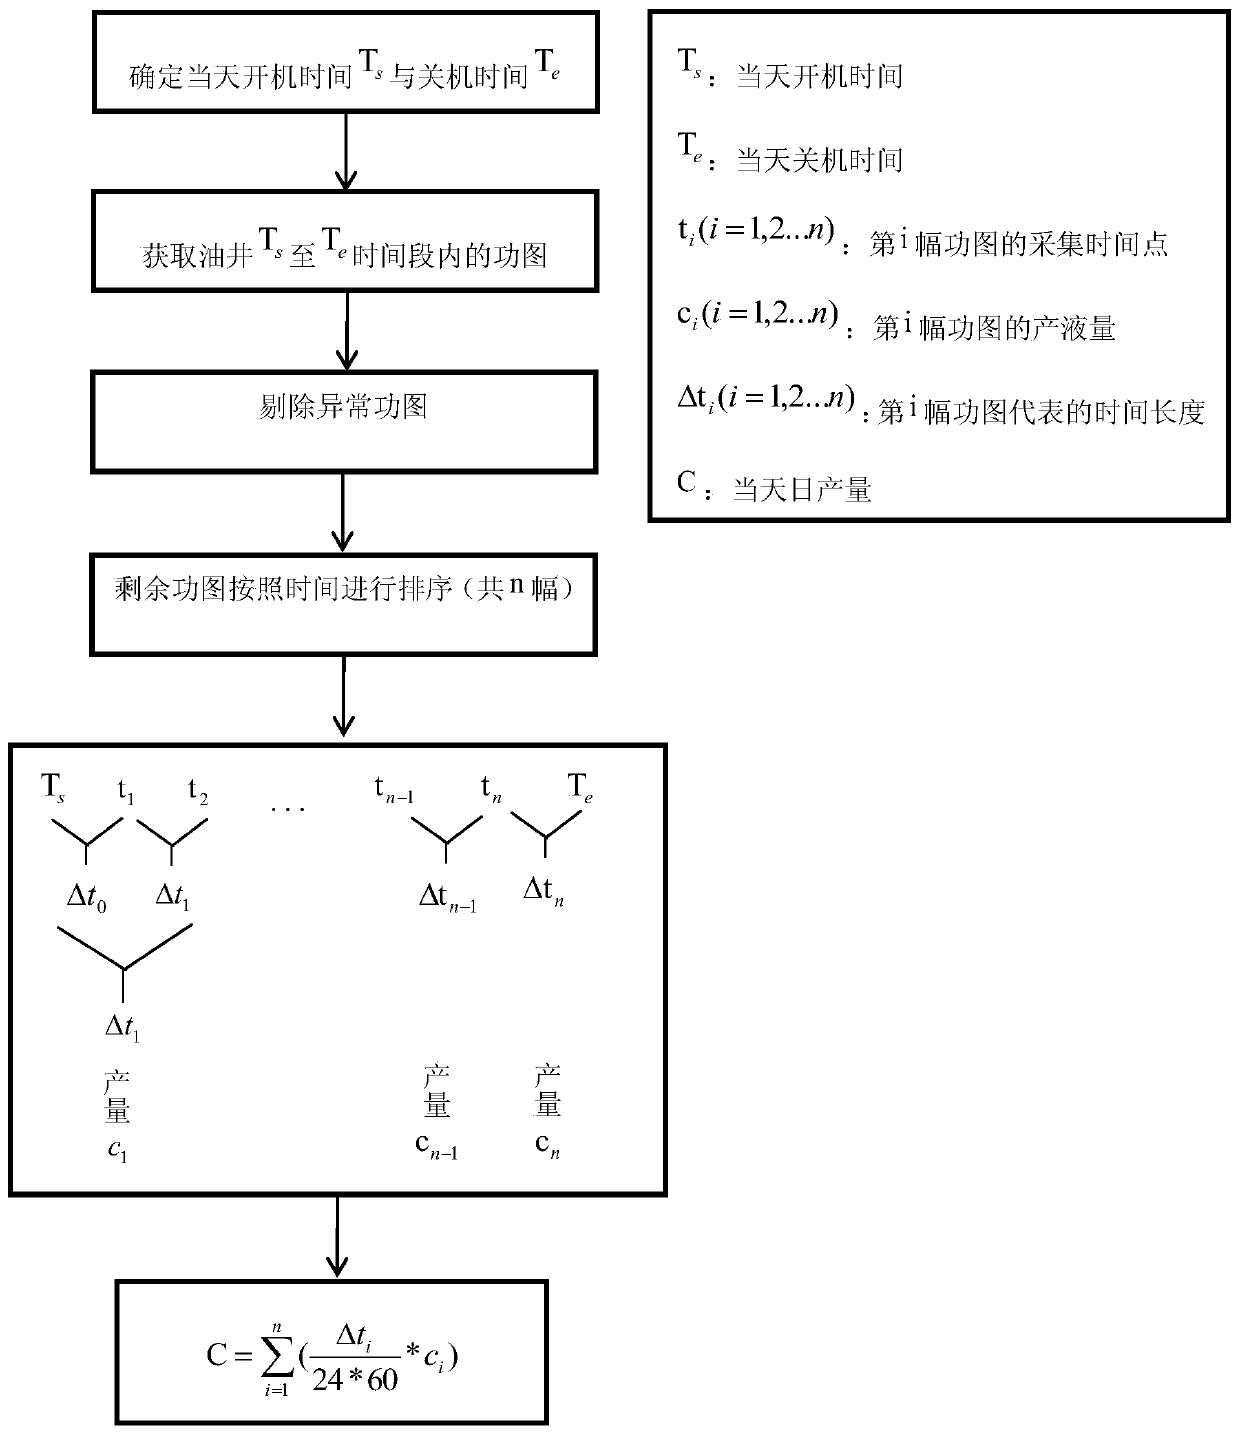
[0042] Such as figure 1 As shown, it specifically includes the following steps:

[0043] 1) Confirm the start-up time T of the oil well s with shutdown time T e ;

[0044] 2) For the boot time period T s to T e Diagnosis and analysis of abnormal work graphs for all the work graphs collected during this period, and elimination of abnormal work gra...

Embodiment 2

[0053] The high-accuracy dynamometer production correction statistical method of the present invention mainly comprises the following steps:

[0054] 1) Confirm the start-up and shutdown time of the oil well; during the production process of the oil well, the start-up and shutdown operations will be performed due to various reasons. Therefore, for the daily production statistics of the oil well, it is necessary to determine the start-up time T of the day s with shutdown time T e ;

[0055] 2) Eliminate abnormal power graphs during the power-on period; during the power-on period, T s to T e After the diagnosis and analysis of all the graphs collected during this period, there will be some graphs with abnormal values ​​and disordered graphs. For example, the number of strokes is 0 or very large, and the graphs are obviously abnormal. power map removal;

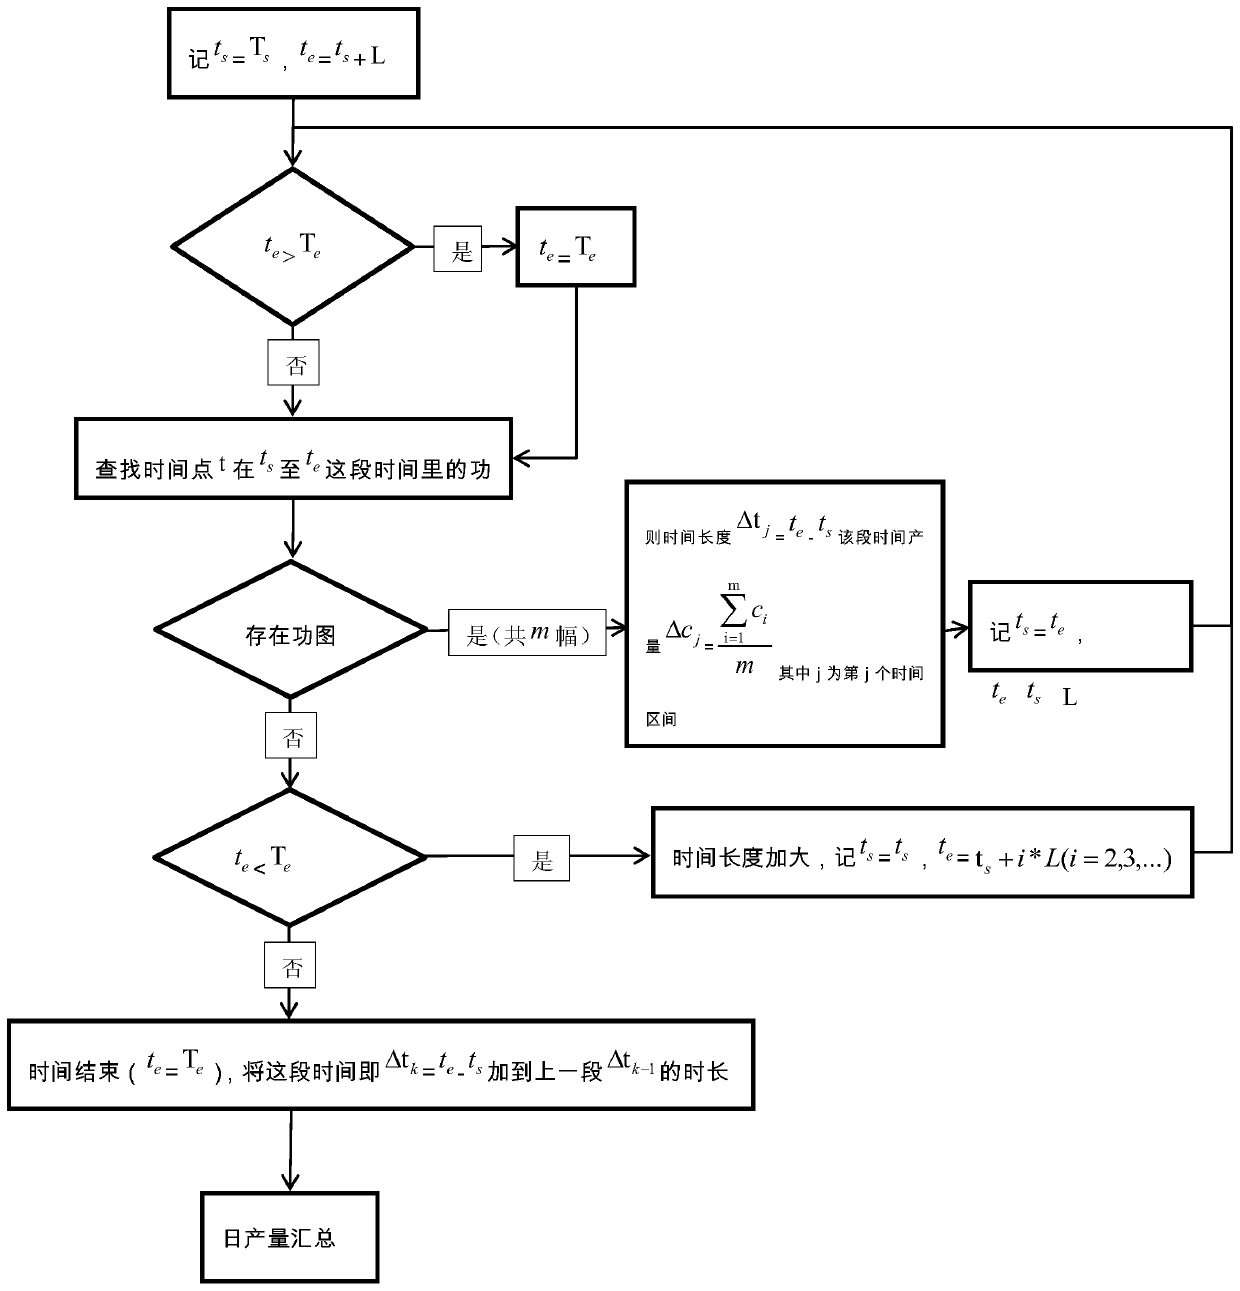
[0056] 3) Determine the length of time represented by each of the remaining graphs; the interval time of each graph collec...

Embodiment 3

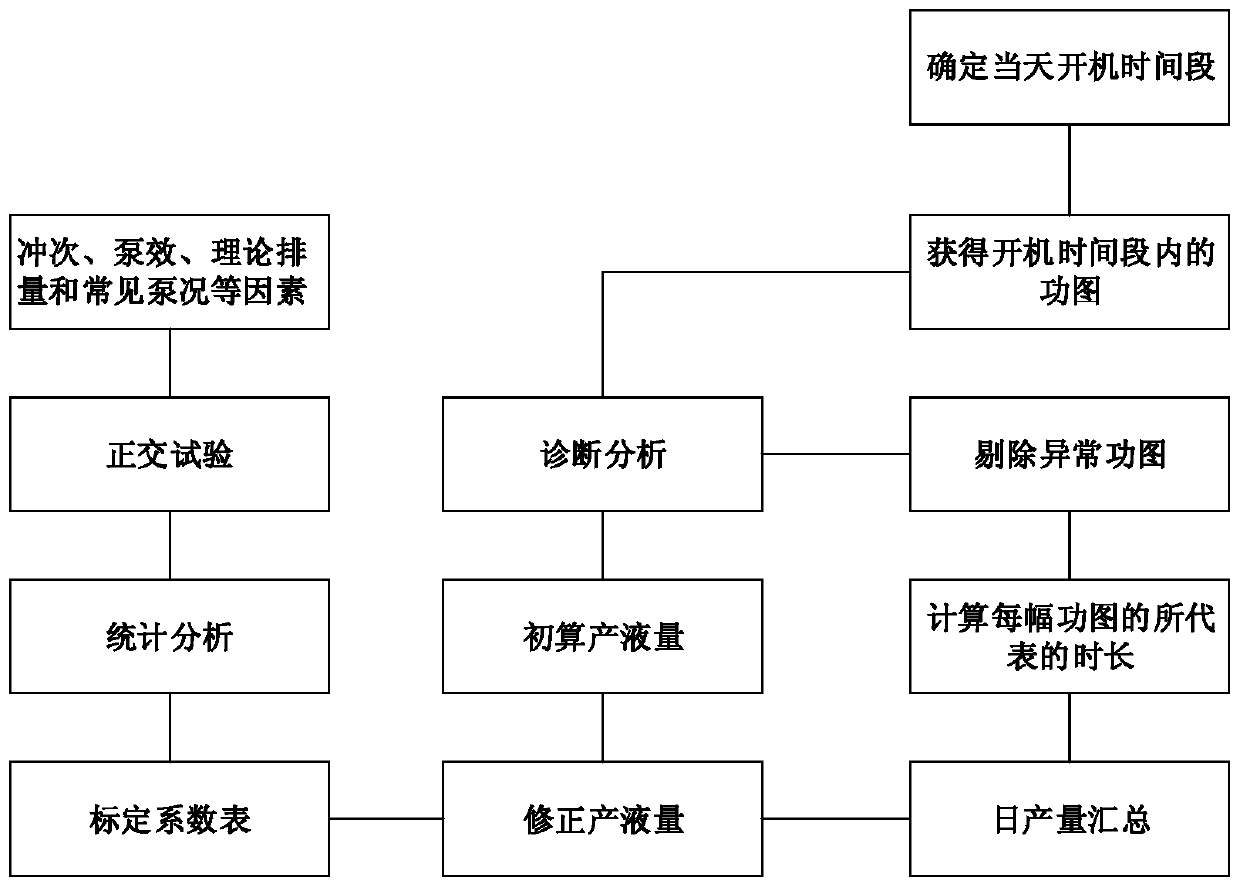
[0077] After the diagnosis and analysis of each work map collected by the oil well, its working condition factors and preliminary calculation of production will be obtained, and then the preliminary calculation of production of each work map will be corrected by querying the calibrated correction coefficient table.

[0078] In this example, if image 3 As shown, the considered factors affecting the fluid production rate of oil wells include pumping times, pump efficiency and theoretical displacement common pump conditions. Stroke times analysis, stroke times not only affect the theoretical displacement of the pump, but also affect the working efficiency of the pump. For example, too fast strokes will increase the theoretical displacement of the pump, but the actual situation may be that the oil does not have time to enter the pump working cylinder, which reduces the pump efficiency.

[0079] According to on-site statistics, there are more than 1,000 oil wells in the productio...


PUM


Abstract

The invention relates to a high-precision indicator diagram production metering correction statistical method, which belongs to the technical field of automatic oil extraction and is characterized bycomprising the following steps of: counting the operation time of an oil well; extracting all indicator diagrams in the running time of the oil well; removing the abnormal indicator diagrams from allindicator diagrams in the oil well operation time to obtain residual indicator diagrams; determining the effective operation time of the oil well corresponding to the residual indicator diagram; and summarizing the yield corresponding to each period of time in the effective operation time to complete high-precision indicator diagram production statistics. The method mainly comprises the steps of oil well startup and shutdown time confirmation; eliminating the abnormal indicator diagram in the startup time period; determining the time length represented by each remaining work map; according tothe high-precision indicator diagram production counting correction statistical method, carrying out daily production statistics according to the timeliness of each indicator diagram. Precision is high, and better and wider adaptability is achieved.

Description

technical field [0001] The invention belongs to the technical field of automatic oil recovery, and in particular relates to a high-precision work chart production correction statistical method. Background technique [0002] With the continuous exploitation of underground oil reservoirs, most oilfields have entered the middle and late stages of exploitation, and the formation energy is not enough to make the oil wells self-spray. At this time, external machinery is needed to assist in the exploitation. Rod pump pumping units are the main equipment of major oilfields. being widely used. Rod pumping system has simple principle, reliable application and long service life. At present, most oil wells in Changqing Oilfield still use rod pumping system. For the pumping system, the most important indicator is its liquid production rate. However, affected by conditions such as formation pressure changes, rod string vibration, and oil well pump operating conditions, the liquid product...

Claims


Application Information

Patent Timeline
Patent Type & Authority Applications(China)
IPC IPC(8): G06Q10/06G06Q50/02
CPCG06Q10/0639G06Q50/02
Inventor 金钟辉罗亚东庄贵林
Owner 陕西安控科技有限公司
Why Eureka
Try Eureka