A non-destructive identification method for low-volume olive oil mixed with soybean oil or corn oil
A technology of corn oil and olive oil, applied in the direction of material excitation analysis, Raman scattering, etc., can solve the problems of complicated operation, limited identification ability, difficult and fast identification, etc., and achieve the effect of simple and fast operation, high identification efficiency and accurate identification
- Summary
- Abstract
- Description
- Claims
- Application Information
AI Technical Summary
Problems solved by technology
Method used
Image
Examples
Embodiment 1
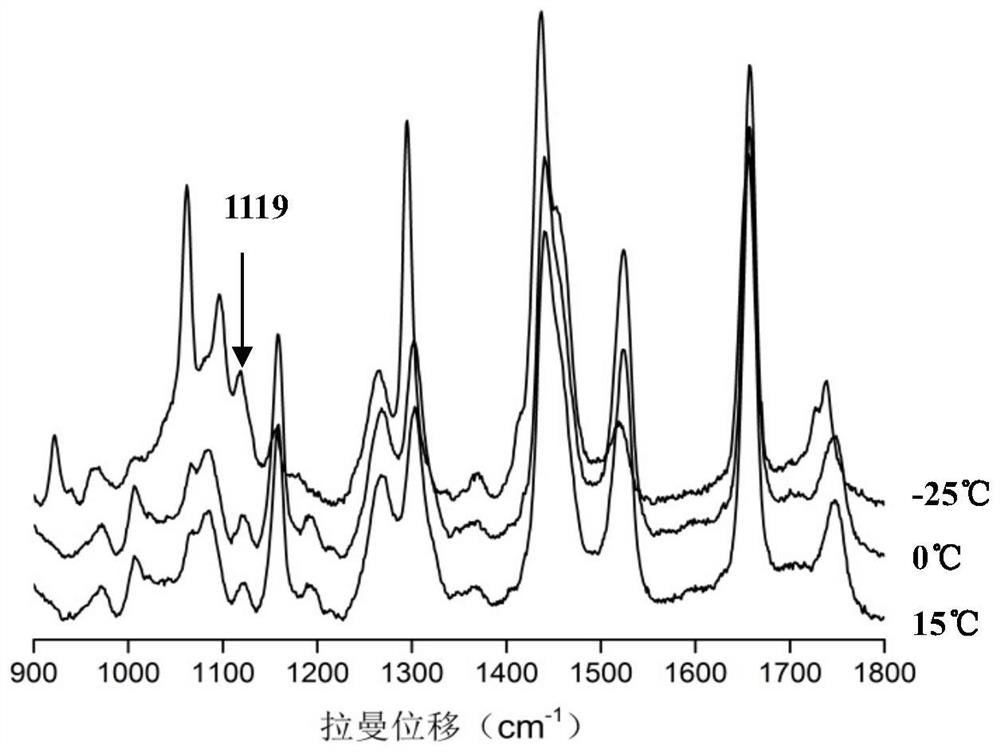
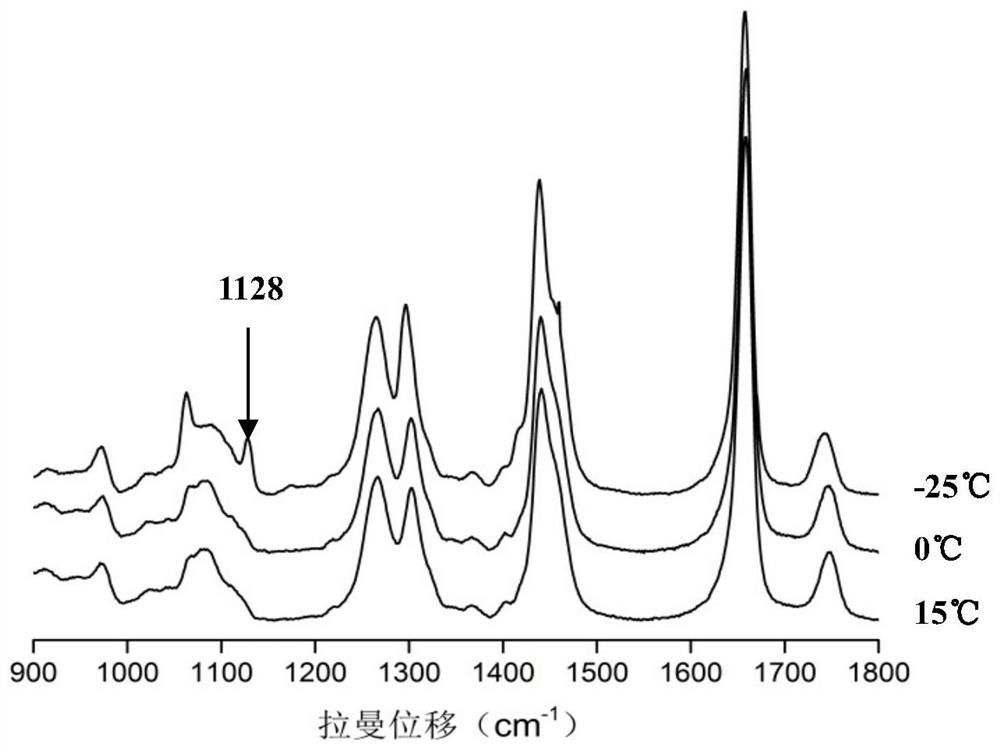
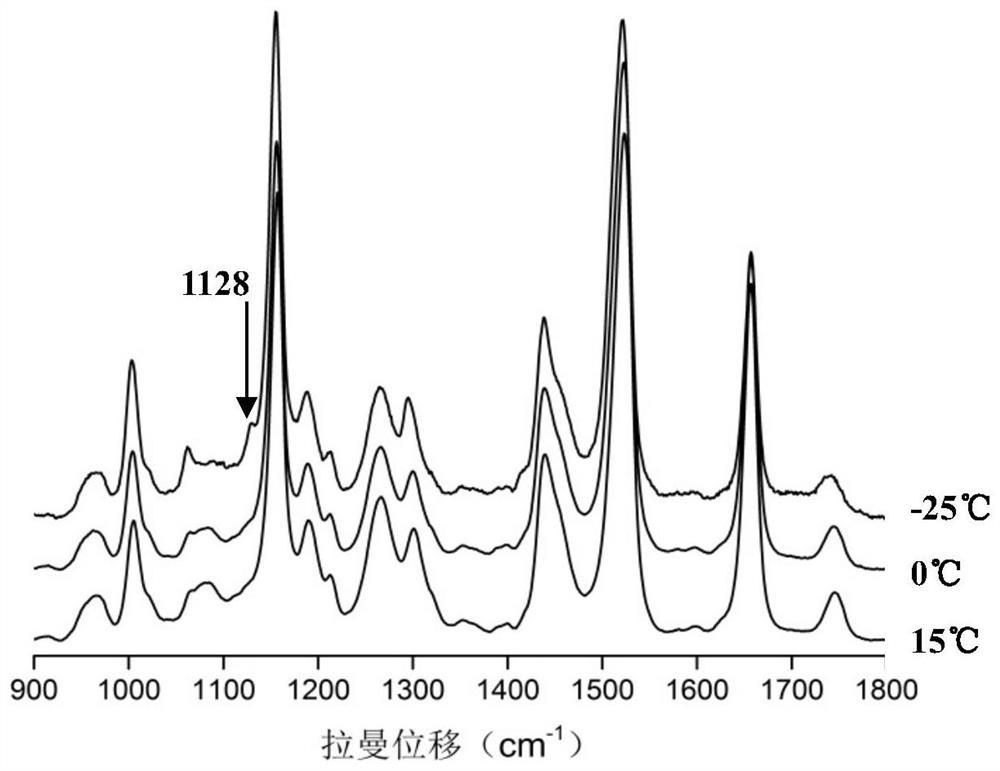
[0040] figure 1 , 2, 3, 4 are the Raman spectra of pure olive oil, transgenic soybean oil, non-transgenic soybean oil, and non-transgenic corn oil at +15°C, 0°C, and -25°C. In the temperature range from +15°C to 0°C, the Raman spectra of these oil samples changed slightly with temperature. At -25°C, olive oil is at 1119cm -1 A characteristic new peak appeared at 1128cm -1 A new characteristic peak appears.
Embodiment 2
[0042] Figure 5 and 6 It is the Raman spectrum and cluster analysis results of adulterated oil samples mixed with 5% transgenic soybean oil in olive oil. Such as Figure 5 As shown, in the temperature range from +15°C to 0°C, the two adulterated oil samples were compared with figure 1 The Raman spectra of medium olive oil have a high similarity and are not easy to distinguish. At -25°C, the adulterated oil sample mixed with 5% transgenic soybean oil was at 1130cm -1 A new peak appears at the figure 1 The characteristic peaks of olive oil in the samples were significantly different.
[0043] Such as Figure 6 As shown, the Raman spectra of the standard samples and blind samples of each oil sample measured at -25°C were transformed into vectors in multi-dimensional space for systematic cluster analysis. Schiff distance, the normalization method is Z-score. The results showed that the adulterated oil samples mixed with 5% transgenic soybean oil were significantly differen...
Embodiment 3
[0049] Figure 11 and 12 It is the Raman spectrum and cluster analysis results of adulterated oil samples mixed with 20% transgenic soybean oil in olive oil. Such as Figure 11 As shown, in the temperature range from +15°C to 0°C, the two adulterated oil samples were compared with figure 1 The Raman spectra of medium olive oil have a high similarity and are not easy to distinguish. At -25°C, the adulterated oil sample mixed with 20% transgenic soybean oil was at 1130cm -1 A new peak appears at the figure 1 The characteristic peaks of olive oil in the samples were significantly different.
[0050] Such as Figure 12 As shown, the Raman spectra of the standard samples and blind samples of each oil sample measured at -25°C were transformed into vectors in multi-dimensional space for systematic cluster analysis. Schiff distance, the normalization method is Z-score. The results showed that the adulterated oil samples blended with 20% GM soybean oil were significantly differe...
PUM
 Abstract
Description
Claims
Application Information
 - R&D
- Intellectual Property
- Life Sciences
- Materials
- Tech Scout
- Unparalleled Data Quality
- Higher Quality Content
- 60% Fewer Hallucinations
Browse by: Latest US Patents, China's latest patents, Technical Efficacy Thesaurus, Application Domain, Technology Topic, Popular Technical Reports.
© 2025 PatSnap. All rights reserved.Legal|Privacy policy|Modern Slavery Act Transparency Statement|Sitemap|About US| Contact US: help@patsnap.com


