Visual analysis method and system for ocean multidimensional data

A technology of multi-dimensional data and analysis methods, applied in the field of visual analysis, can solve the problems of not discovering the correlation of dimensional attributes, unable to accurately judge the correlation of dimensional data of marine data, and difficult to effectively display the specific information of original data, etc., to achieve visualization Intuitive effect

Active Publication Date: 2019-08-06
SHANGHAI OCEAN UNIV
View PDF2 Cites 18 Cited by
  • Summary
  • Abstract
  • Description
  • Claims
  • Application Information

AI Technical Summary

Problems solved by technology

Ocean big data has the characteristics of massive, multi-source, multi-dimensional, dynamic, spatial, and heterogeneous. Traditional visual analysis technologies have certain limitations in mining the hidden information behind ocean data:
[0020] (2) Traditional visual analysis technology cannot accurately judge the correlation of marine data and data of various dimensions
[0021] (3) The visual analysis of marine data based on scatter plots is not suitable for the situation where all dimensions need to be displayed at the same time; and with the increase of data dimensions, the scale of the scatter plot matrix increases, which is difficult for the layout of the visual interface and the understanding of users Brings a burden, and based on the expansion of two-dimensional scatter diagrams, it does not have the ability to discover more dimensional attribute correlations, and there are still limitations
[0022] (4) The visual analysis of marine data based on parallel coordinates will lead to dense lines and overlapping coverage caused by large-scale data items, and it is difficult to effectively display the specific information of each dimension of the original data, which has certain limitations
When performing similarity measurement, it is necessary to calculate the difference between two pairs of data, resulting in a huge amount of calculation

Method used


Image

  • Visual analysis method and system for ocean multidimensional data
  • Visual analysis method and system for ocean multidimensional data
  • Visual analysis method and system for ocean multidimensional data

Examples


Embodiment

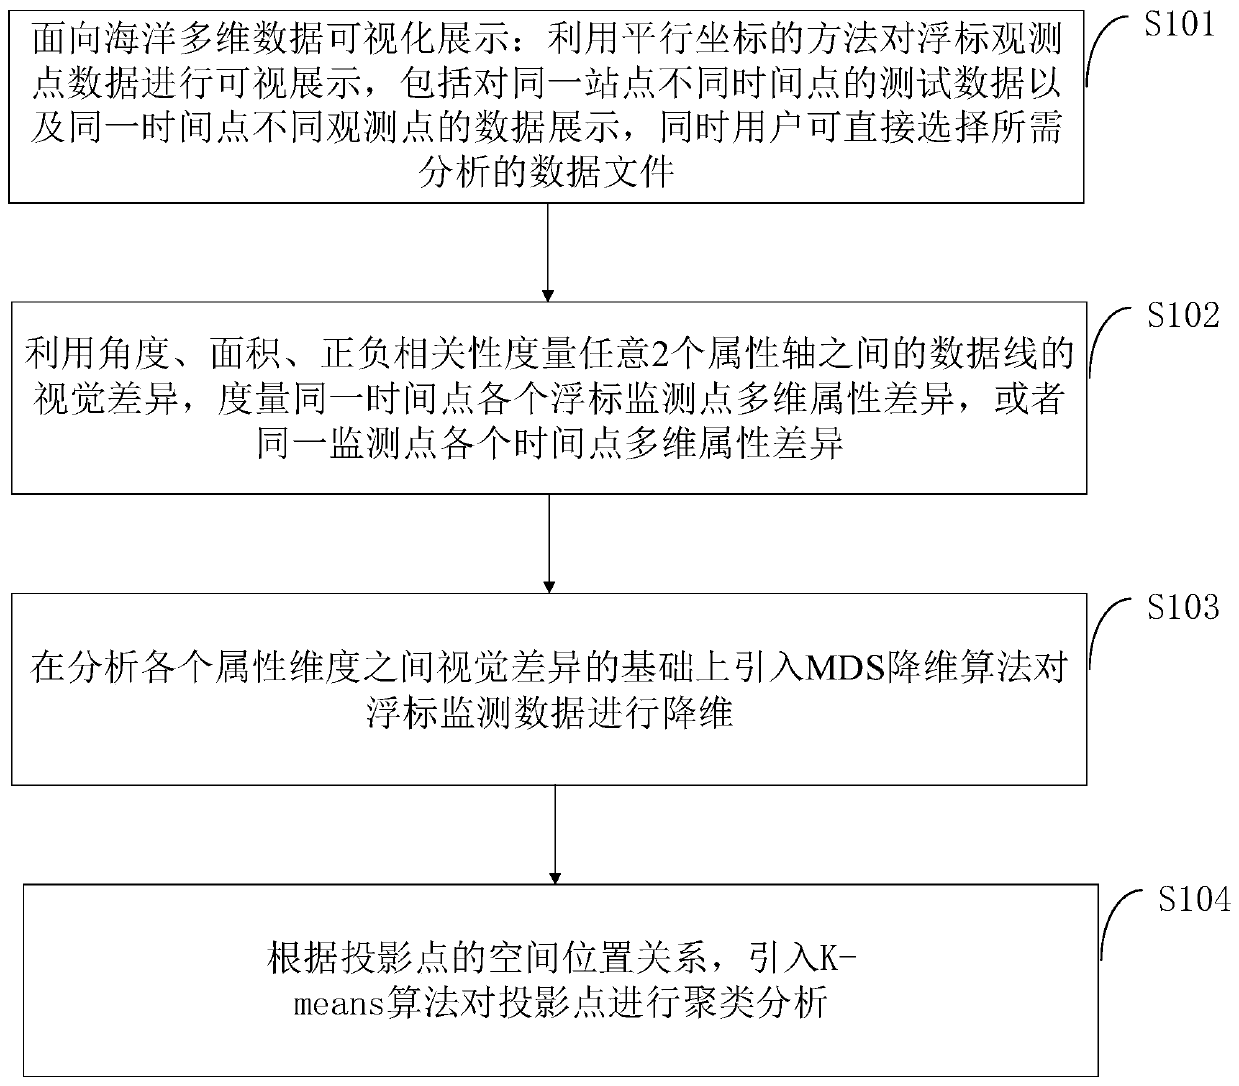
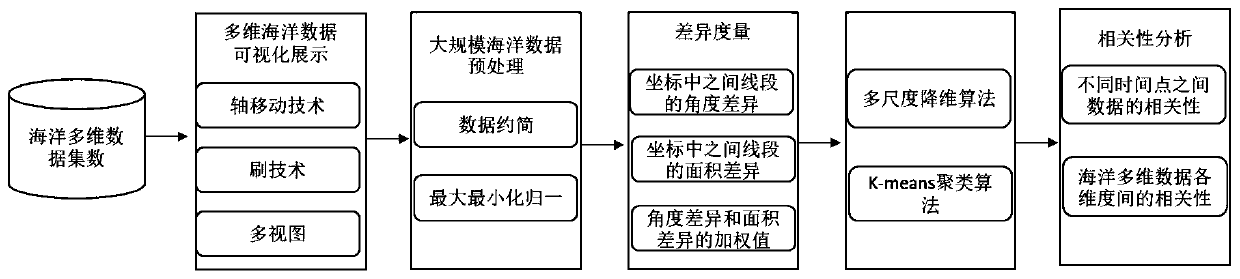
[0174] Such as figure 2 As shown, the present invention is divided into five steps to carry out the visual analysis method facing ocean multidimensional data including:

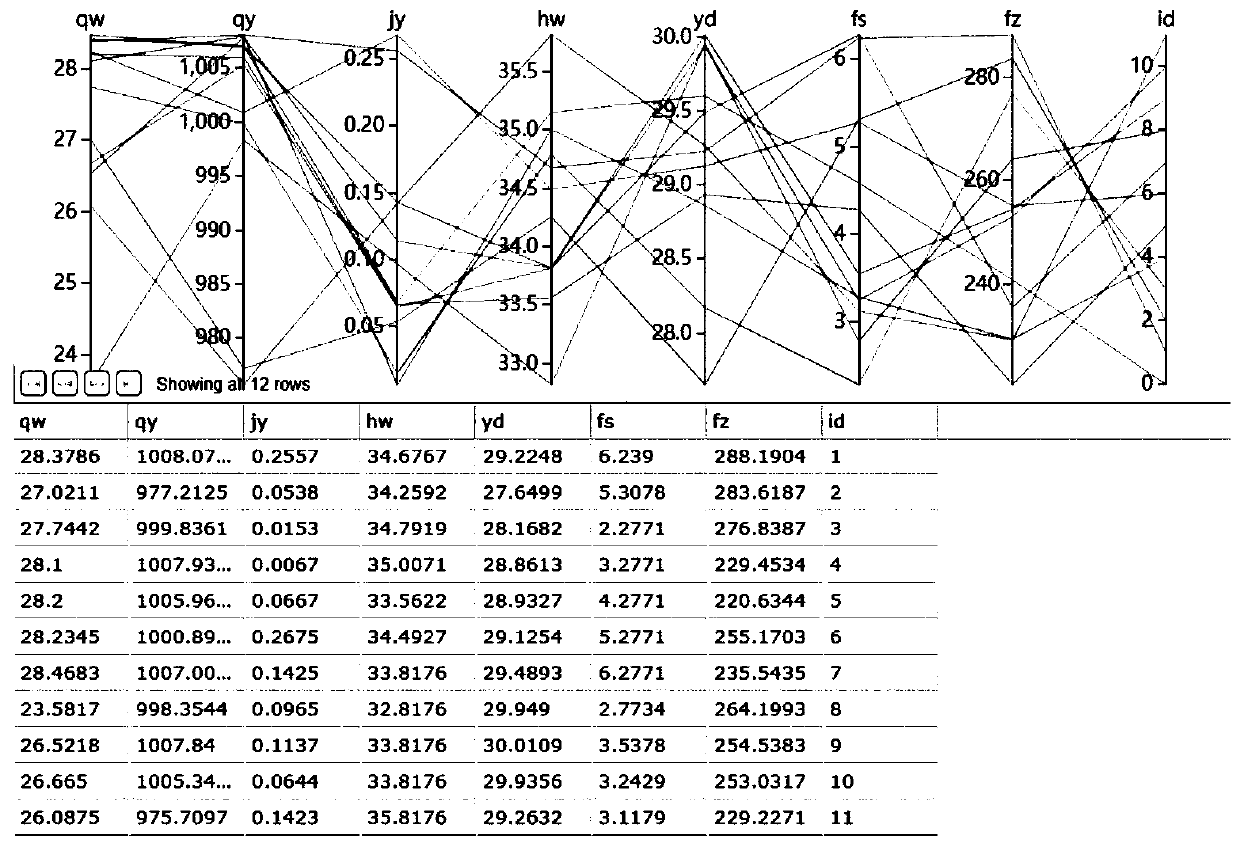
[0175] The first step is to use parallel coordinates to display ocean multi-dimensional attribute data. The parallel coordinates allow users to arrange the axes, and the brush technology is introduced to allow users to filter the data of interest on the parallel coordinate axes. At the same time, in order to highlight a piece of data in the parallel coordinates The distribution of data, allowing users to directly select a certain data in the data column and realize the highlighting in parallel coordinates;

[0176] The second step is to perform data reduction on large-scale marine multidimensional data, and then use the maximum-minimum normalization algorithm to preprocess the data;

[0177] The third step is to introduce angle, area, positive and negative correlation and other methods to measure the differ...


PUM


Abstract

The invention belongs to the technical field of visual analysis, discloses a visual analysis method and system for ocean multidimensional data, and aims to reduce large-scale ocean data by using a dimension reduction method on the basis of reserving a data relation. The correlation among the ocean multi-dimensional data and the correlation among the dimensions is analyzed on the basis of visual display; and a multi-view visual analysis method suitable for ocean multi-dimensional data is further improved. According to the parallel coordinate visual analysis method provided by the invention, thebuoy observation point data is visually displayed, and a user is supported to directly select a data file needing to be analyzed; a sliding block function is added to select a time point which a useris interested in or a certain dimension data value interval, so that data which the user wants to observe can be displayed more visually; interested data is selected from the lower data bar, and thedistribution condition of the interested data can be highlighted in the visual parallel coordinates, so that the visual effect is more visual.

Description

technical field [0001] The invention belongs to the technical field of visual analysis, and in particular relates to a visual analysis method and system for marine multidimensional data. Background technique [0002] At present, the existing technologies commonly used in the industry are as follows: [0003] At present, my country has formed a comprehensive ocean monitoring network, resulting in explosive growth of ocean data. The sources of monitoring data include aerial remote sensing, marine stations, buoy observation systems, etc.; multiple sources lead to the use of different data mining techniques when obtaining marine data, which in turn leads to differences in data formats, parameters and areas of use of marine data. There are huge differences; at the same time, marine data contains some sensitive information such as meteorology, hydrology, disaster warning, etc., and security measures need to be taken; on the other hand, the application value of marine data must be...

Claims


Application Information

Patent Timeline
Patent Type & Authority Applications(China)
IPC IPC(8): G06F16/215G06F16/26
CPCG06F16/215G06F16/26Y02A90/10
Inventor 贺琪武欣怡宋巍王振华黄冬梅杨巧青
Owner SHANGHAI OCEAN UNIV
Why Eureka
Try Eureka