Space-time mode visual analysis system and method based on air quality data

A technology of air quality, analysis system, applied in the field of visualization

Pending Publication Date: 2019-10-29
NORTHEAST NORMAL UNIVERSITY
View PDF4 Cites 20 Cited by
  • Summary
  • Abstract
  • Description
  • Claims
  • Application Information

AI Technical Summary

Problems solved by technology

However, the characteristics of large-scale, multi-variable, and time-varying dat...

Method used


Image

  • Space-time mode visual analysis system and method based on air quality data
  • Space-time mode visual analysis system and method based on air quality data
  • Space-time mode visual analysis system and method based on air quality data

Examples


Embodiment 1

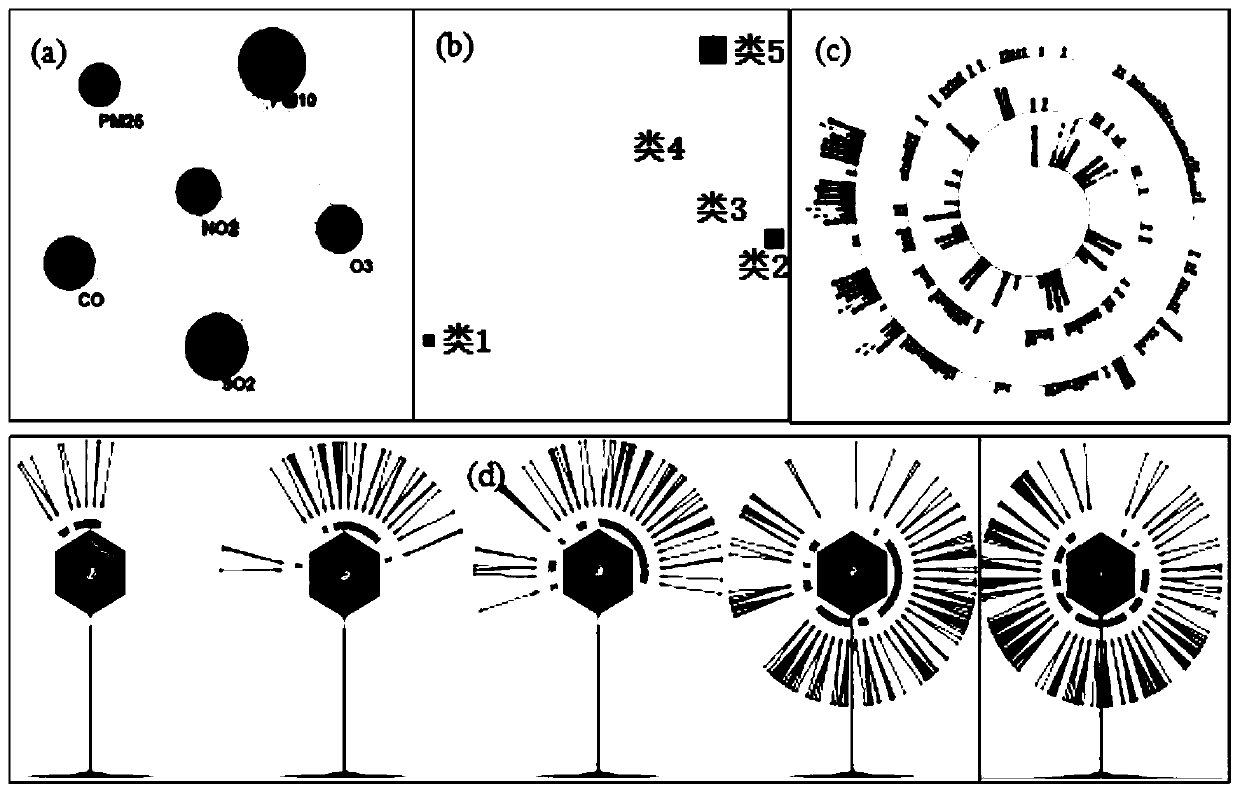
[0048] In the first embodiment, for the visual exploration of the time-varying pattern of a single city: in this embodiment, Baoding City, Hebei Province was selected from January 5, 2015 to January 3, 2016, and the data of 52 weeks were explored to explore the time-varying pattern distribution of the city. A single city selects all the air quality data of the city for clustering, and then explores its time-varying patterns.

[0049] It is worth noting that we use information entropy and mutual information to measure the uncertainty of variables and the correlation between variables respectively. Large information entropy indicates that the data contains a lot of information, which may directly affect the division of clustering results; mutual information between variables The larger the value, the stronger the correlation of the variables. Based on this, the variables are divided into smaller groups to guide users to explore the air pollution data dimension subspace; informati...

Embodiment 2

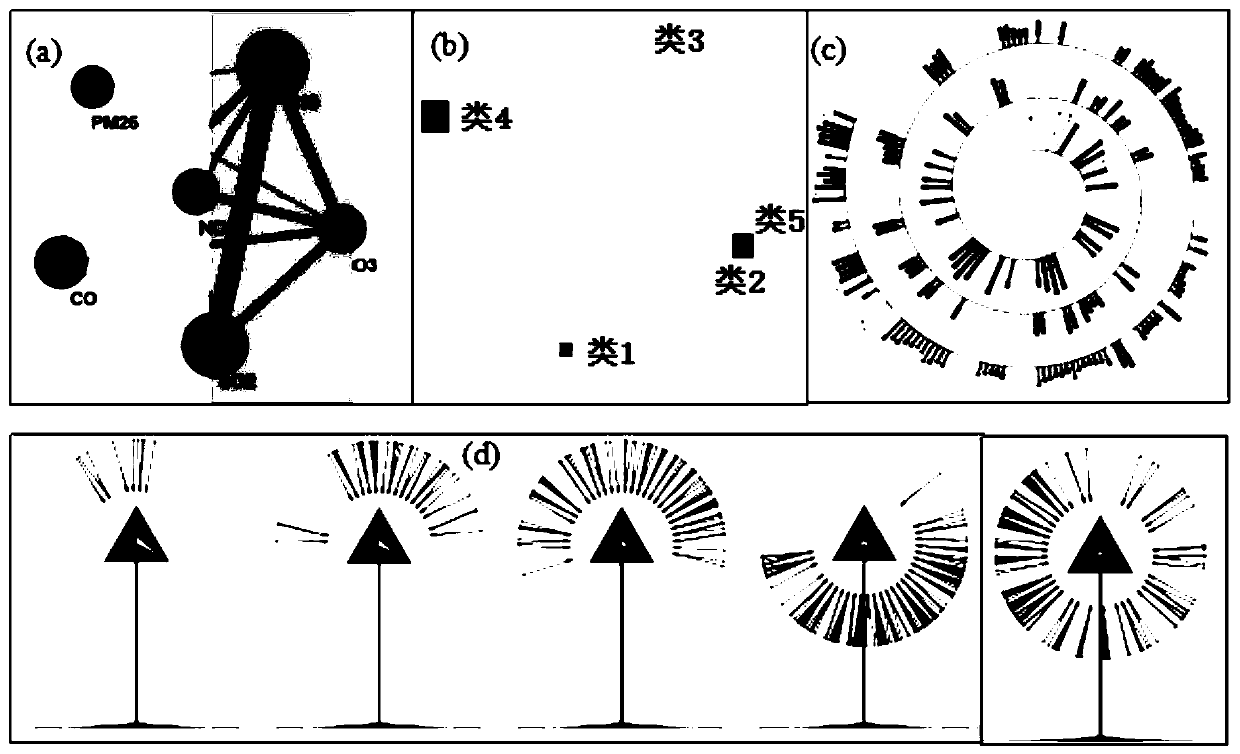
[0060] Example 2: Visual exploration of urban agglomeration spatio-temporal patterns: We selected 84 cities such as Beijing, Baoding, and Langfang from the map for a total of 14 weeks from September 28, 2015 to January 3, 2016, to view different patterns of urban agglomeration data For the degree of aggregation and continuity of distribution in space and time, please refer to Figure 4 , select the urban agglomeration through the circular brush operation, Figure 4 The b is a scatter diagram of the spatio-temporal distribution characteristics of the clustered categories to help users select the categories of interest; Figure 5 The time-varying trend view between models helps researchers analyze the dynamic factors of air quality changes; Figure 6 A view of the spatiotemporal distribution between modalities, which helps researchers explore how cities are distributed in space and time in different modalities.

[0061] It is worth noting that exploring the space-time patterns...

Embodiment 3

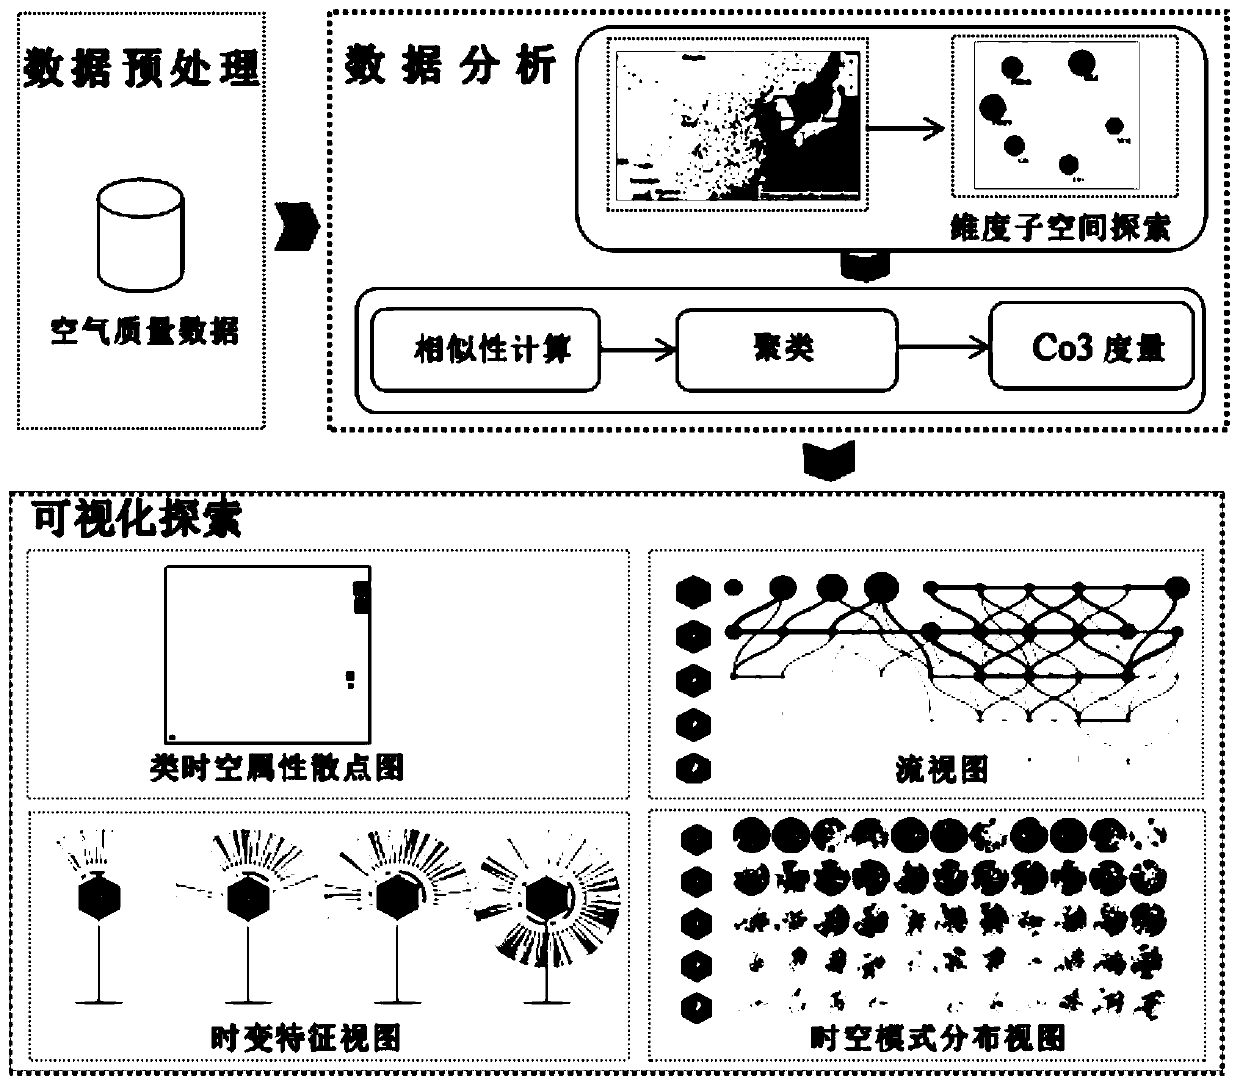
[0073] In embodiment three, a method for visual analysis of spatio-temporal patterns based on air quality data is based on a visual analysis system for spatio-temporal patterns based on air quality data described in embodiment one, including division of dimension subspaces, Canopy+ K-means clustering algorithm and concentration and continuity identify air quality spatio-temporal patterns, divide the dimension subspace by extracting urban air quality data, and process the dimension subspace of the air quality data according to information entropy and mutual information ; By the Canopy+K-means clustering algorithm, the data with similar characteristics in the air quality data are divided into the same class, so as to obtain the spatio-temporal pattern of the class; The degree of aggregation and the degree of continuity of the distribution in the spatio-temporal pattern are judged for concentration and continuity, respectively.

[0074] The purpose of dimensional subspace divisio...


PUM


Abstract

The invention relates to the technical field of visualization and aims to provide a space-time mode visual analysis system based on air quality data. The system comprises a data preprocessing module,a data analysis module and a visualization module. Visual analysis is mainly explored from time sequence changes of a single city, time sequence changes of different modes of adjacent city groups in geographic space and inter-city space relevance in the modes, and an analysis result is coordinated through multi-view linkage. An interactive view is designed to represent a specific data distributioncharacteristic mode. A rule mode and an abnormal mode are explored in the space-time characteristics. Furthermore, the mode is further analyzed to extract valuable information. An analyst can be helped to visually and comprehensively analyze a conventional mode of air quality data, explore implicit data mode exploration mode distribution characteristics and explore a time-varying trend, decisionsupport is provided for the analyst, and a scientific basis is provided for making an air pollution treatment policy.

Description

technical field [0001] The invention relates to the field of visualization, in particular to a visual analysis system and method for spatio-temporal patterns based on air quality data. Background technique [0002] In recent years, the problem of global air pollution has become more and more serious, which has attracted the attention of many experts and scholars. Visual analysis is an effective means of analyzing big data, which can help users intuitively explore the inherent laws of data. To date, researchers have proposed a variety of analytical methods to study air quality issues. However, the existing air quality research mainly focuses on the time-varying characteristics of single pollutants, and seldom considers the correlation analysis between pollutants, and then explores the influence of highly correlated dimensional subspaces on the distribution of time-varying patterns of data. At the same time, regarding the analysis of spatio-temporal patterns of urban agglome...

Claims


Application Information

Patent Timeline
IPC IPC(8): G06F16/26G06K9/62G06Q50/26
CPCG06F16/26G06Q50/26G06F18/23213
Inventor 张慧杰任珂曲德展吕程蔺依铭王蓉
Owner NORTHEAST NORMAL UNIVERSITY
Why Eureka
Try Eureka