Refined diagnosis method for urban agglomeration area flood risk zoning

A flood and urban technology, which is applied in the field of flood risk assessment and diagnosis method construction, can solve the problems of large evaluation unit scale, disordered determination of index weights by principal component analysis method, large spatial scale and inability to accurately locate flood risk, etc., to achieve Achieve consistency, reliable technical support means, and optimize the effect of weight calculation steps

Inactive Publication Date: 2019-11-15
TIANJIN UNIV
View PDF3 Cites 11 Cited by
  • Summary
  • Abstract
  • Description
  • Claims
  • Application Information

AI Technical Summary

Problems solved by technology

[0003] At present, there are mainly principal component analysis and analytic hierarchy process for flood risk zoning. These two methods can reflect the distribution characteristics of flood risk to a certain extent, but there are also some shortcomings. problem; AHP has the arbitrariness of subjective determination of weight
In addition, the current flood risk zoning mainly divides the evaluation units by administrative boundaries such as districts and counties. Due to the large spatial scale, it is impossible to accurately locate the flood risk.
Therefore, in order to improve the current risk zoning method and the shortcomings of large evaluation unit scales, the present invention provides a fuzzy analytic hierarchy process for fine flood risk zoning in urban agglomerations in order to accurately and objectively diagnose the flood risk characteristics of urban agglomerations , to provide a scientific basis for improving and implementing flood emergency plans and enhancing flood emergency management capabilities

Method used


Image

  • Refined diagnosis method for urban agglomeration area flood risk zoning
  • Refined diagnosis method for urban agglomeration area flood risk zoning
  • Refined diagnosis method for urban agglomeration area flood risk zoning

Examples


Embodiment Construction

[0042] Specific embodiments of the present invention will be described in detail below in conjunction with the accompanying drawings. It should be understood that the specific embodiments described here are only used to illustrate the present invention, and are not intended to limit the present invention.

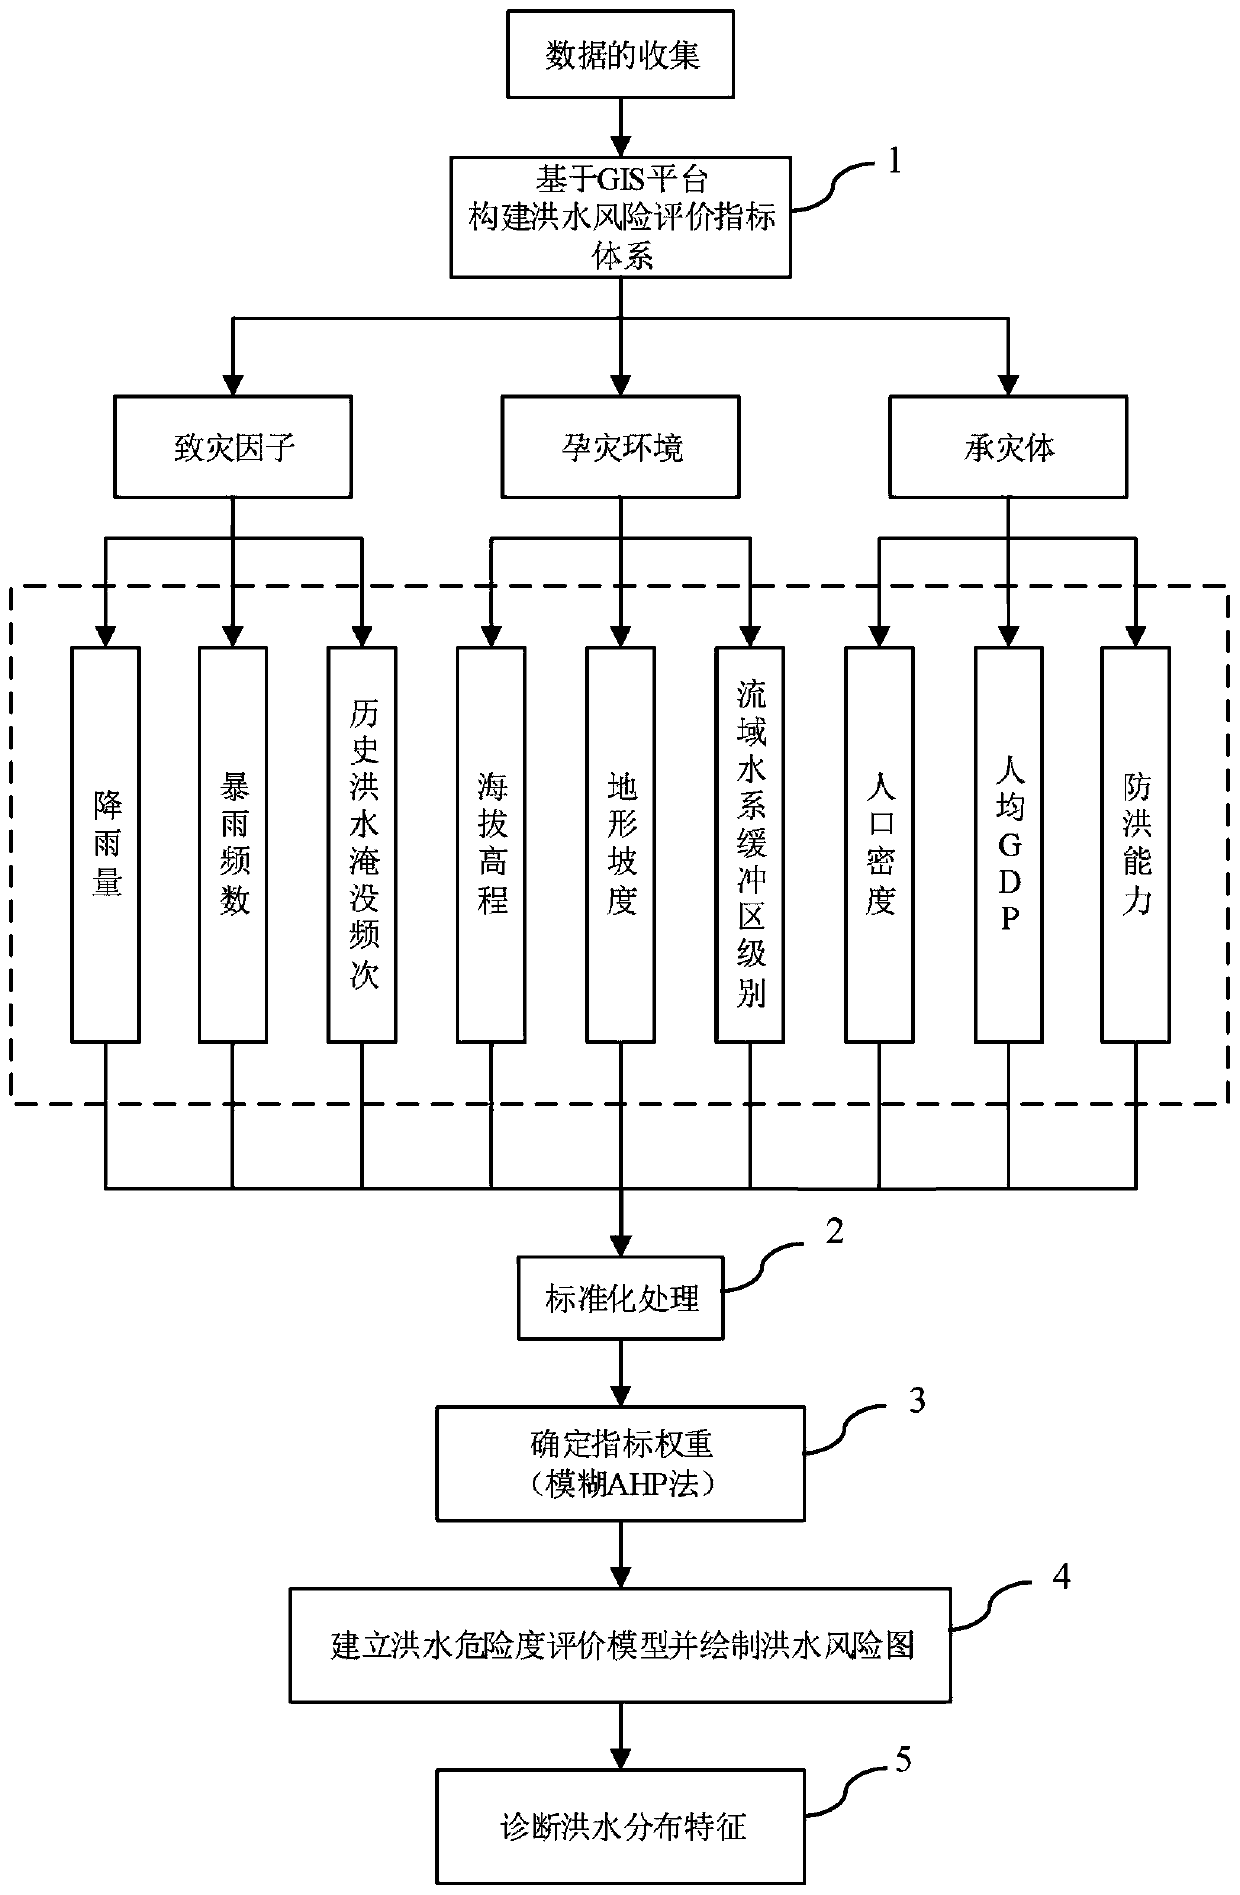
[0043] Such as figure 1 Shown is a flow chart of a diagnostic method for flood risk zoning of the present application, which specifically includes the following steps:

[0044]Step 1. According to the risk concept framework and flood disaster system, and on the basis of comprehensive consideration of the purpose, system, scientific and operability principles determined by the flood risk evaluation index system, construct a flood risk evaluation index system based on the GIS platform, Divide the flood risk evaluation index system into three levels, namely the target layer, criterion layer and index layer, and establish a hierarchical structure according to the hierarchical ...


PUM


Abstract

The invention discloses a refined diagnosis method for urban agglomeration area flood risk zoning. The method comprises the following steps of using a GIS spatial data analysis function to carry out data rasterization and standardization processing on each index; constructing a judgment matrix corresponding to the index system; calculating the relative weight of each index and the flood risk degree of different grid units so that establishment of an urban agglomeration area flood risk degree evaluation model based on a fuzzy analytic hierarchy process and drawing of a flood risk map are realized. From the perspectives of rainstorm distribution characteristics, historical flood distribution characteristics, rainstorm ponding risk distribution characteristics of all cities and the like, theflood risk distribution characteristics of urban agglomeration areas are systematically diagnosed in an omnibearing and multi-angle mode. The flood risk degrees and risk levels of different dangerousareas are accurately calculated, a multi-index problem is scientifically and objectively synthesized into a single-index form, a single index capable of effectively measuring the flood risk degree isconstructed, and a reliable technical support means is provided for flood dangerous area division.

Description

technical field [0001] The invention relates to the technical field of emergency disaster prevention diagnosis, in particular to the construction of a flood risk assessment and diagnosis method. Background technique [0002] Urban agglomeration is an urban regional system formed by the spatial interaction of several densely distributed cities of different levels and their hinterlands. With the acceleration of urbanization, extreme weather occurs frequently, the area of ​​impermeable ground continues to increase, population and wealth continue to gather, and the risk of urban flood disasters is increasing, posing a great threat to people's production and life. Therefore, it is not only an important basis for urban emergency disaster prevention, but also the need for urban risk management and sustainable development to carry out flood risk zoning in urban agglomeration areas and accurately diagnose the distribution characteristics of flood risk in this area. [0003] At prese...

Claims


Application Information

Patent Timeline
Patent Type & Authority Applications(China)
IPC IPC(8): G06Q10/06G06F16/29G06Q50/26
CPCG06Q10/0635G06Q50/26G06F16/29Y02A10/40
Inventor 苑希民王秀杰田福昌桑林浩孙瑀王艳鹏
Owner TIANJIN UNIV
Why Eureka
Try Eureka