

Planar microwave cavity drip-in type liquid dielectric substance value detection sensor
A microwave cavity and dielectric technology, which is applied in the direction of material analysis, instruments, and measurement devices using microwave means to achieve the effect of simple processing circuits
- Summary
- Abstract
- Description
- Claims
- Application Information
AI Technical Summary
Problems solved by technology
Method used
Image


Examples
Embodiment Construction
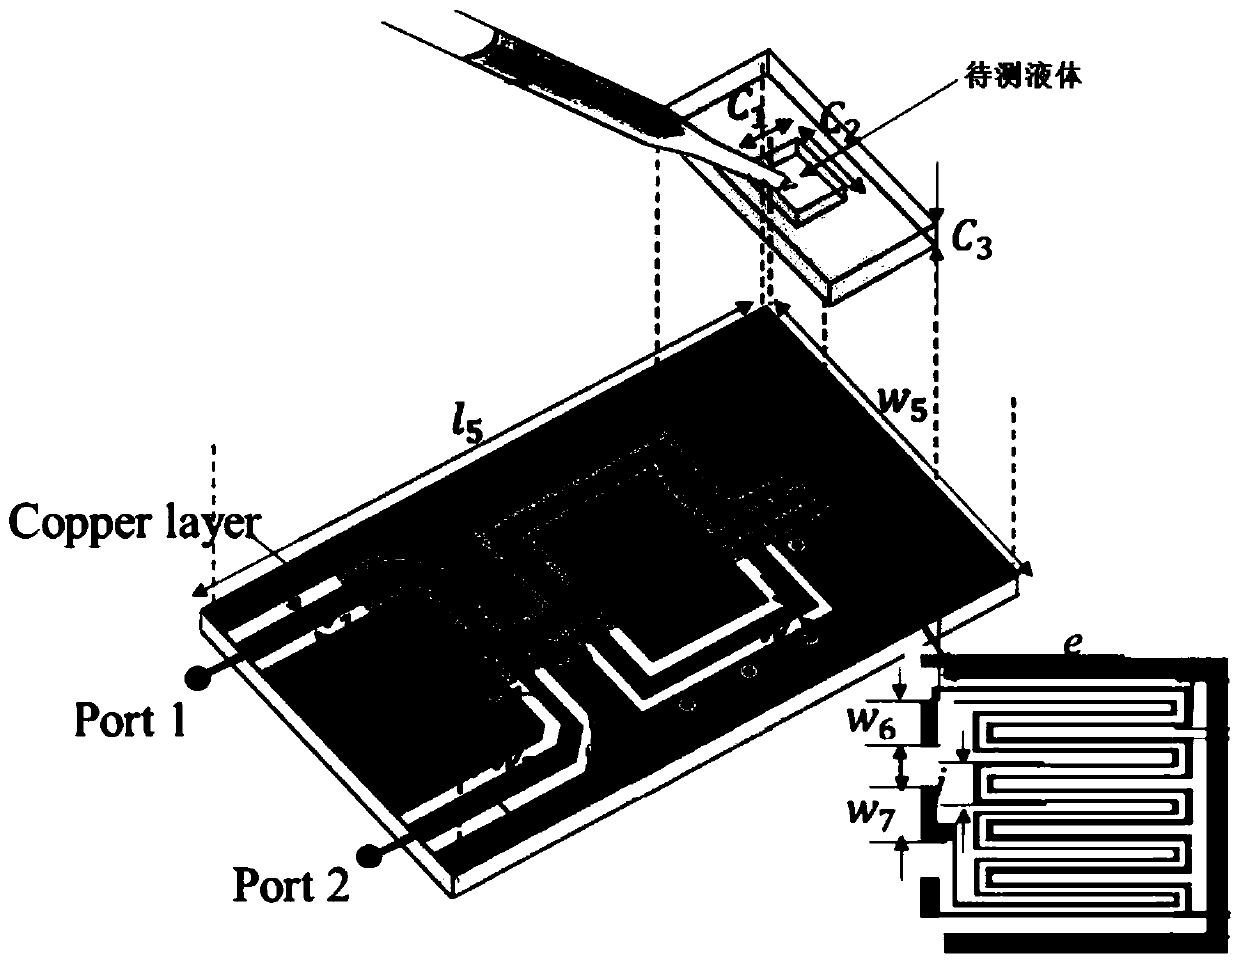
[0028] The inner dimension of the FR4 container that the present invention adopts is 7.5 * 7.5mm 2 , to cover the sensor detection area. The height of the container is 1.6 mm, which provides enough space for adjusting the volume of the liquid to be measured. The width and length of the container (ie c1 and c2) are respectively larger than the width of the detection area sensor (4.1×4.6mm 2 ) 3.4 and 2.9mm larger to ensure that the liquid to be tested is exposed to the electric field on the side of the container.
[0029] A parametric study of the influence of the volume of the liquid to be measured on the reflected notch frequency and decibels is carried out. different volumes of liquid to be tested for the evaluation of the sensor, Figure 5 Displays the measurement results. S11 was evaluated for different volumes of 0.02, 0.04, 0.06, 0.08 and 0.1 mL of deionized (DI) water placed on the detection area. Deionized water was chosen because it has a high dielectric constant...
PUM
 Abstract
Description
Claims
Application Information