Construction and application evaluation of molecular model for predicting postoperative early recurrence risk of liver cancer
A technique for prognostic assessment and liver cancer, applied in the field of medical biological detection, can solve problems such as unsatisfactory prediction results
- Summary
- Abstract
- Description
- Claims
- Application Information
AI Technical Summary
Problems solved by technology
Method used
Image
Examples
Embodiment 1
[0237] Example 1 Screening of Gene Sets Generally Differentially Expressed in Liver Cancer
[0238] The GEO database (http: / / www.ncbi.nlm.nih.gov / geo / ) is a public gene expression database that currently has more than 94000 datasets and more than 2 million samples. With appropriate analysis methods and analysis tools, these datasets have been widely used for biomarker identification and molecular typing of diseases, etc. However, the samples or detection platforms included in each data set are different, and the analysis results between different data sets vary greatly. Therefore, cross-analysis of the results of multiple data sets will avoid this selection bias and make the results more objective.
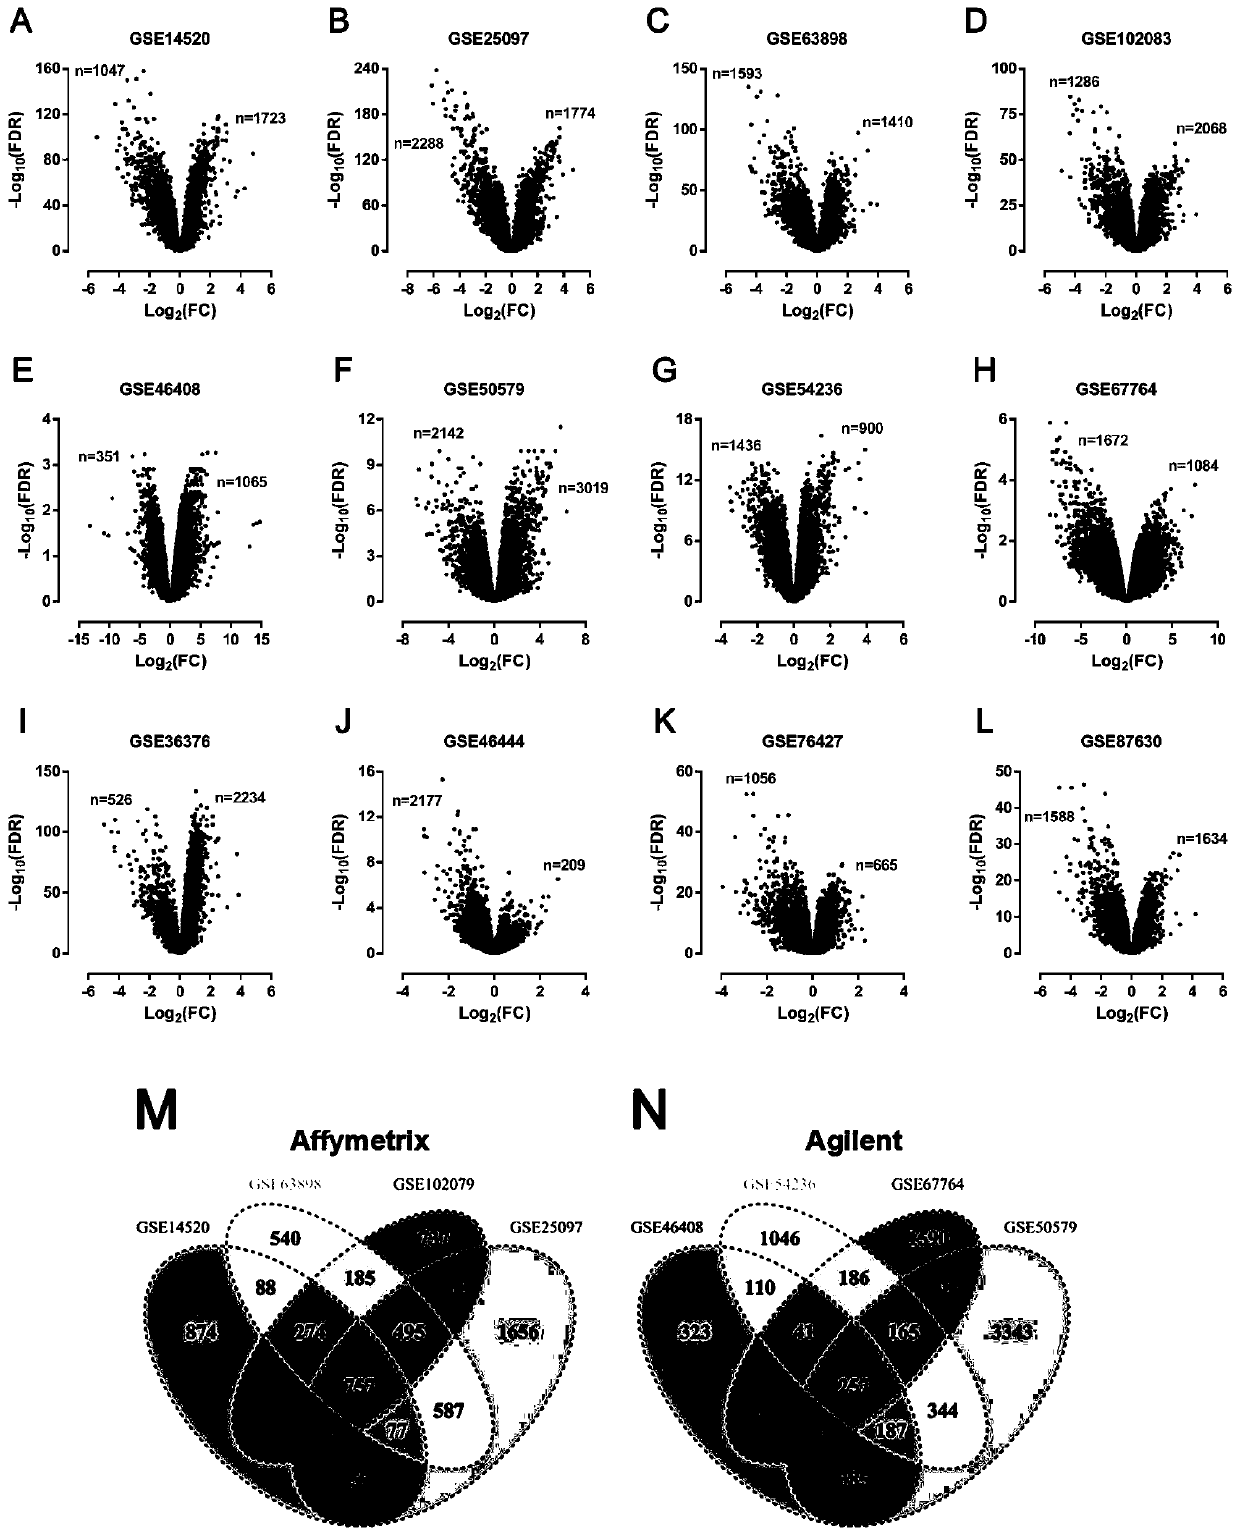
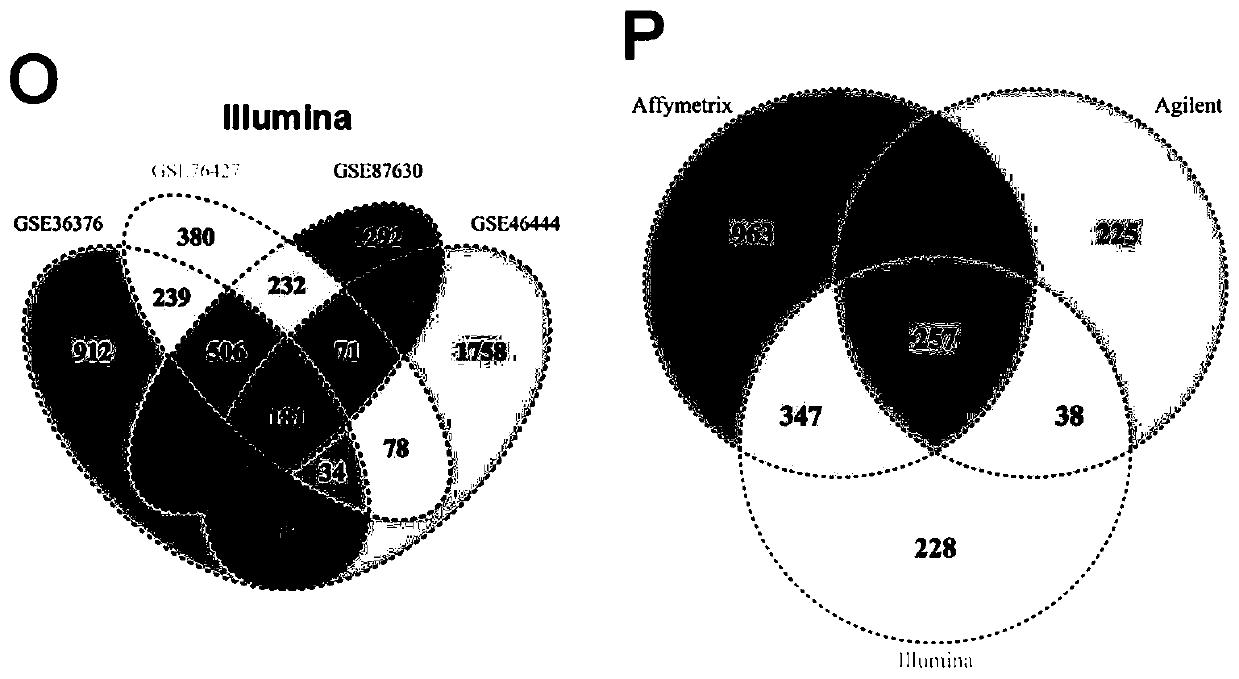
[0239] In this example, 12 liver cancer data sets from the three most commonly used sequencing platforms (Affymetrix, Agilent and Illumina) were analyzed, and each sequencing platform contained 4 data sets (Table 1). Differentially expressed genes were identified for each datase...
Embodiment 2
[0240] Example 2 Constructing a LASSO risk model for predicting early recurrence of liver cancer in GSE14520
[0241]Among the 12 GEO datasets included, GSE14520 was the only one with complete clinical outcome data. Therefore, based on the aforementioned 257 candidate differentially expressed genes, this example seeks to construct a risk model in GSE14520 that can effectively predict the early recurrence of liver cancer after surgery. First, draw the ROC curve according to the expression value of each gene, and determine the critical expression value and AUC value of each gene. According to the cutoff value of each gene, the 221 patients in GSE14520 were divided into low and high expression status of the gene. Next, Cox univariate analysis was performed on each gene to calculate the p-value. When a gene satisfies both AUC≥0.55 and p-value<0.25, it will be included in the next step of LASSO risk model construction. Finally, 112 genes met the above conditions, among which 30 ...
Embodiment 3
[0243] Embodiment 3 evaluates the predictive value of this risk model in GSE14520
[0244] According to the risk model formula, calculate the risk score of each patient in GSE14520, such as image 3 As shown in A, as the risk score increases, patients with liver cancer tend to have early postoperative recurrence. The optimal critical value was determined by drawing the ROC curve -0.2600, and patients were divided into low and high risk groups according to the critical value. Such as image 3 As shown in B, there was a significant difference in the early postoperative recurrence rate between the low-risk and high-risk groups at 6 months after surgery (1.65% in the low-risk group and 25% in the high-risk group, p-value image 3 C). In addition, the ROC curve showed that the risk model had excellent predictive value at 6 months, 12 months, 18 months and 24 months after operation, with AUC values of 0.837, 0.843, 0.835 and 0.846 (all p values image 3 D). Furthermore, compar...
PUM
 Abstract
Description
Claims
Application Information
 - R&D
- Intellectual Property
- Life Sciences
- Materials
- Tech Scout
- Unparalleled Data Quality
- Higher Quality Content
- 60% Fewer Hallucinations
Browse by: Latest US Patents, China's latest patents, Technical Efficacy Thesaurus, Application Domain, Technology Topic, Popular Technical Reports.
© 2025 PatSnap. All rights reserved.Legal|Privacy policy|Modern Slavery Act Transparency Statement|Sitemap|About US| Contact US: help@patsnap.com


