
Linear approximation abnormal lower limit determination method

A straight line approximation and determination method technology, applied in the field of data analysis research, can solve problems such as uncertain k value, low calculation and processing efficiency, and inability to determine the upper limit of negative anomalies, so as to achieve the effect of improving efficiency and reasonable results

Active Publication Date: 2019-12-31
甘肃省地质调查院
View PDF4 Cites 2 Cited by
  • Summary
  • Abstract
  • Description
  • Claims
  • Application Information

AI Technical Summary

Problems solved by technology

[0009] 3. The traditional method of determining the lower limit of anomalies can only determine the lower limit of the positive anomaly of the number set, but cannot determine the upper limit of the negative anomaly
It does not conform to the three-point distribution characteristics of the test data set (positive anomaly, background, negative anomaly), such as the geological fact that the loss of geochemical elements cannot be studied, and the accurate research on data in the era of big data cannot be satisfied.
[0010] 4. The traditional method of determining the lower limit of abnormality, because the k value is uncertain (determined by the effect of the graph), the method of determining the lower limit of the graphic abnormality can only be drawn manually
Therefore, the traditional method of determining the lower limit of abnormalities cannot compile computer software, and cannot meet the processing requirements of large amounts of data with multiple maps and elements.

Method used


Image

  • Linear approximation abnormal lower limit determination method
  • Linear approximation abnormal lower limit determination method
  • Linear approximation abnormal lower limit determination method

Examples


Embodiment 1

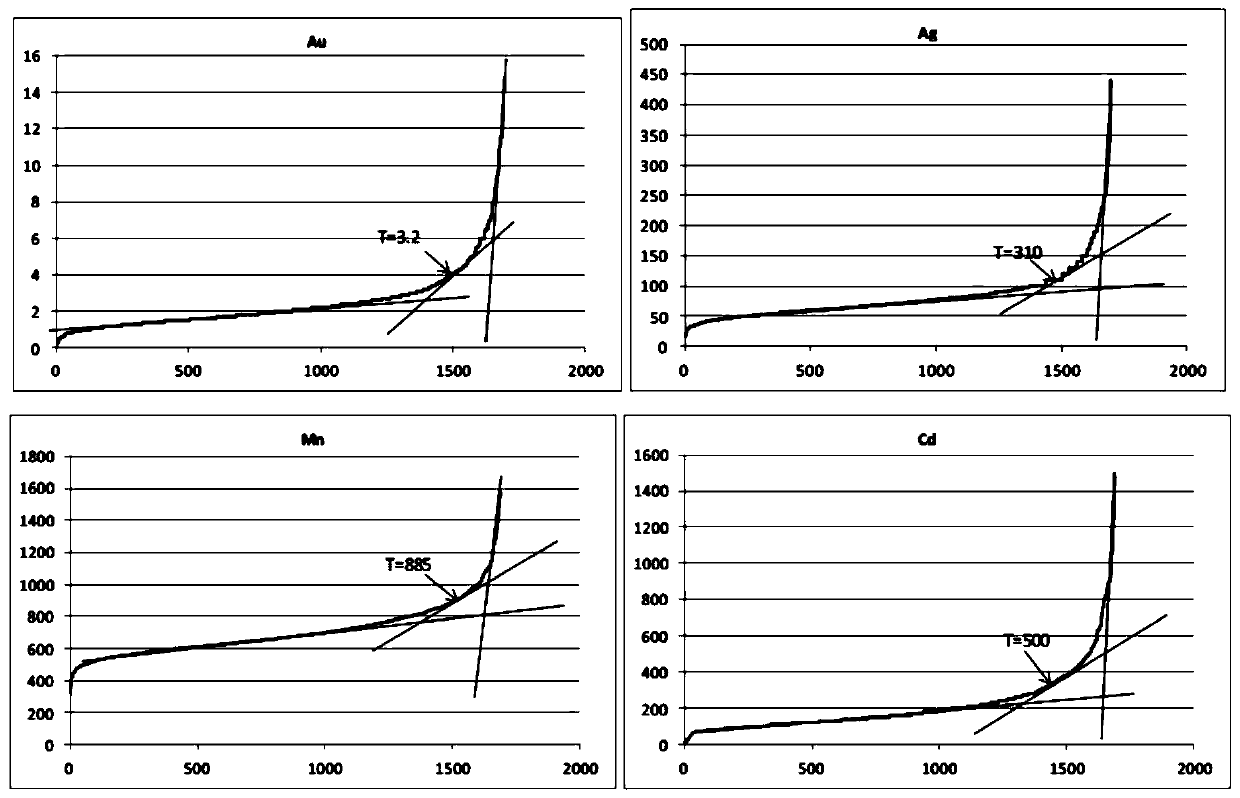
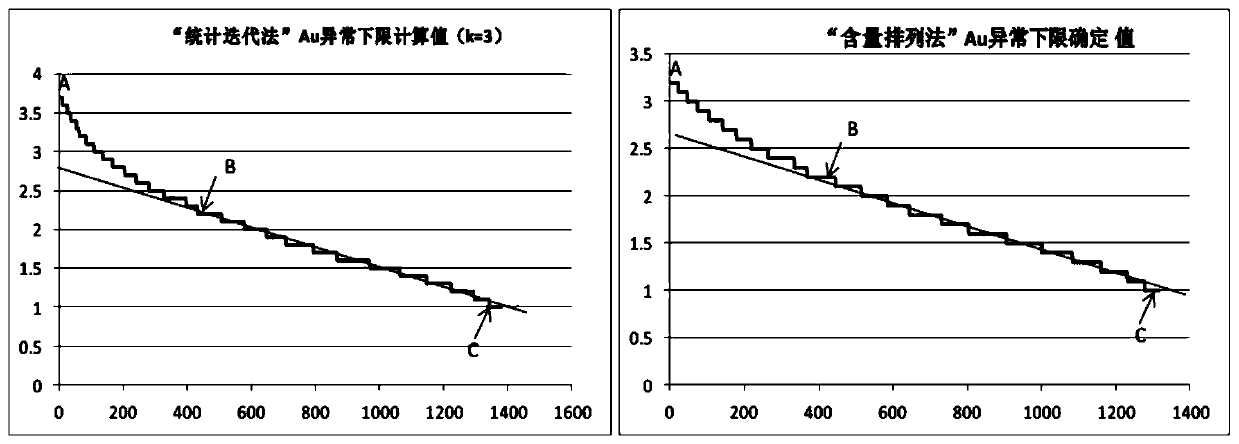
[0050] 1. Calculation method of "statistical iteration": for each element number set in the instance For the calculation formula, select k=2 and k=3 respectively, and iteratively calculate the abnormal lower limit of different k values ​​(see Figure 7 ). Generally, the calculation results of the abnormal lower limit of different values ​​of k are quite different. In the example, the relative average error of the abnormal calculation results of different values ​​of Au, Ag, and Mn elements is greater than 10%. When the standard deviation of the number set is large (the data distribution is uneven), the abnormal lower limit calculated by taking the k value of 2 or 3 is very different, and the relative average error of the Cd element is as high as 41.5%.

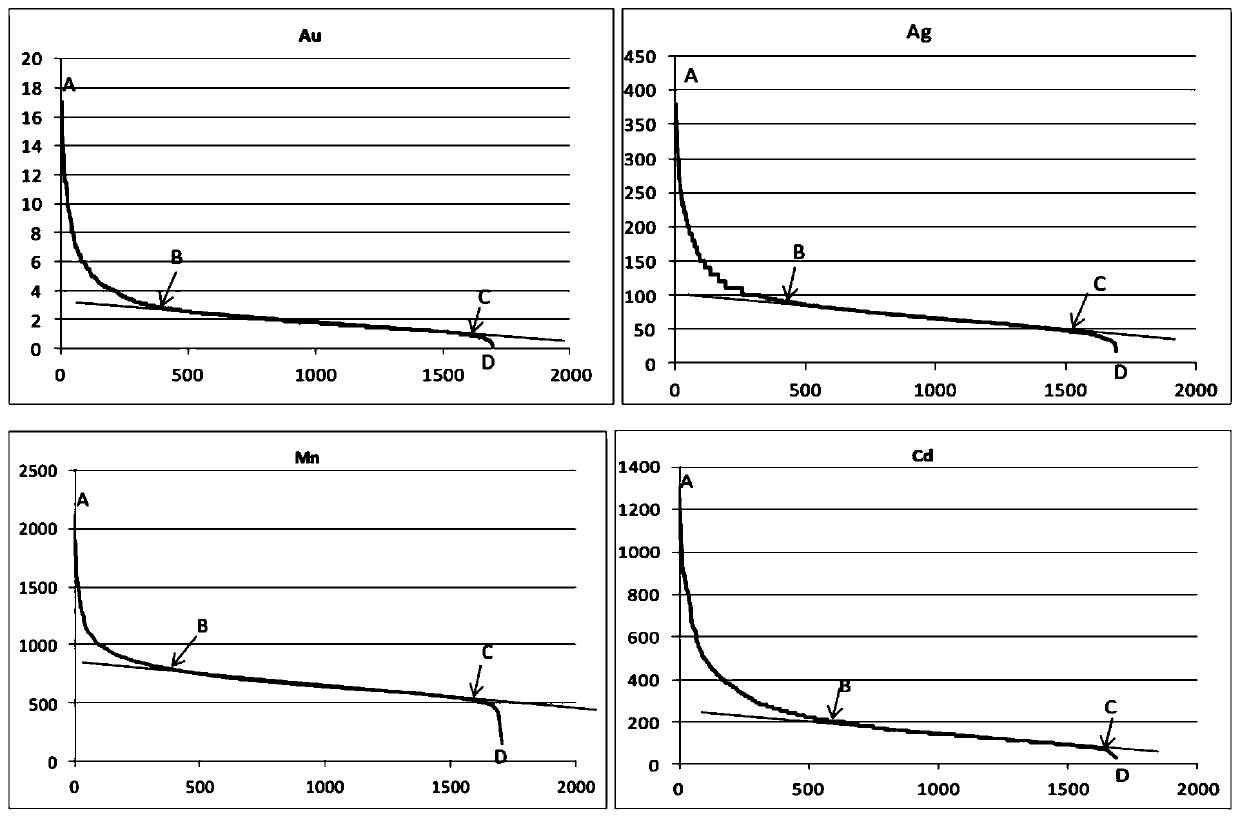
[0051] 2. Graphic method of content arrangement: use the "content arrangement method" to determine the abnormal lower limit of Au, Ag, Mn, and Cd elements in the example, and the graphic results of each element (see Figu...

Embodiment 2

[0056] The method of calculating the lower limit of the background abnormality by straight line fitting and iterative approximation of the test digital set - "straight line approximation method". The specific "straight line approximation" method and steps are described as follows taking the Au element in the example as an example:

[0057] 1. Select k=3 for the number set of Au element in the example, and write the "statistical iteration method" abnormal lower limit algorithm model (after 6 iterations), obtain the preliminary abnormal lower limit of Au element (greater than 3.75), and the minimum value of the number set is 0.2, Get a new set of numbers (3.75—0.2).

[0058] 2. Arrange the new number set (3.75—0.2) in descending order from large to small, write the algorithm model with the test value as (y) value and the sequence number as (x) value, do a straight line fit on the new number set and calculate its fitting degree (R 2 ). Determine the straight line function ( F...

Embodiment 3

[0063] According to the method described in Example 2, the positive anomalous lower limit and negative anomalous upper limit of Ag, Mn, and Cd elements are calculated respectively, see Figure 5 , 7 .


PUM


Abstract

The invention relates to a linear approximation anomaly lower limit determination method, which is based on a rule that a test data background part obeys normal distribution and linear distribution must obey high normal distribution. The method comprises the following steps of writing an algorithm model to accurately separate a background part in the test digital set by using a statistical linearfitting successive approximation method through repetition (iteration) by means of a computer; wherein the upper limit and the lower limit of the separated background part are respectively the lower limit value of the positive anomaly and the upper limit value of the negative anomaly of the digital set, and the anomaly lower limit can be quickly, simply and accurately determined by the method.

Description

technical field [0001] The invention belongs to the field of data analysis research, and in particular relates to a method for determining the abnormal lower limit of "straight line approximation". Background technique [0002] Based on the fact that the background part of the test data obeys the law of normal distribution, there are nearly ten traditional methods for determining the lower limit of abnormality, and the calculation results of different methods vary greatly. So far, there is no method that convinces everyone, which seriously affects the research results. Uniformity and standardization. Inductively, there are two types of existing methods for determining the lower limit of anomalies: [0003] 1. Calculation method: "statistical iteration" calculation method ("The People's Republic of China Geology and Mineral Industry [0004] -Industry standard 1: 50,000 Geochemical Census Specifications (DZ / T 0011—91) "recommended method) as a representative, T = x ± kδ, (T...

Claims


Application Information

Patent Timeline
Patent Type & Authority Applications(China)
IPC IPC(8): G06F16/2458
CPCG06F16/2462Y02E60/00
Inventor 罗建民
Owner 甘肃省地质调查院
Learn More