Calibration set and validation set selection method based on spectral similarity and modeling method
A technology of spectral similarity and modeling method, which is applied in the field of calibration set and verification set selection and modeling based on spectral similarity, can solve the problem of whether unknown samples have a good prediction and is difficult to determine, and achieve strong prediction ability, good modeling performance
- Summary
- Abstract
- Description
- Claims
- Application Information
AI Technical Summary
Problems solved by technology
Method used
Image
Examples
Embodiment 1
[0082] See Table 1 for the results of building models for the four components of corn data in this example. where Lv is the number of latent factors, N c is the number of samples in the calibration set, N v is the number of samples in the validation set.
[0083] Table 1 List of prediction results of each component of corn
[0084]
[0085] It can be seen from Table 1 that the smaller the values of RMSEC, RMSEV and RMSEP, the better, and R c , R v and R p The bigger the better. Each component of corn has a good modeling effect, and the correction set correlation coefficient R c All reached above 0.95, indicating that the model has good performance and a good fitting effect, and only about 40 samples were selected as the calibration set. Validation set correlation coefficient R v Both reached above 0.95, indicating that the model has a good predictive ability for the verification set samples, and for the randomly selected independent test set, except for oil, the r...
Embodiment 2
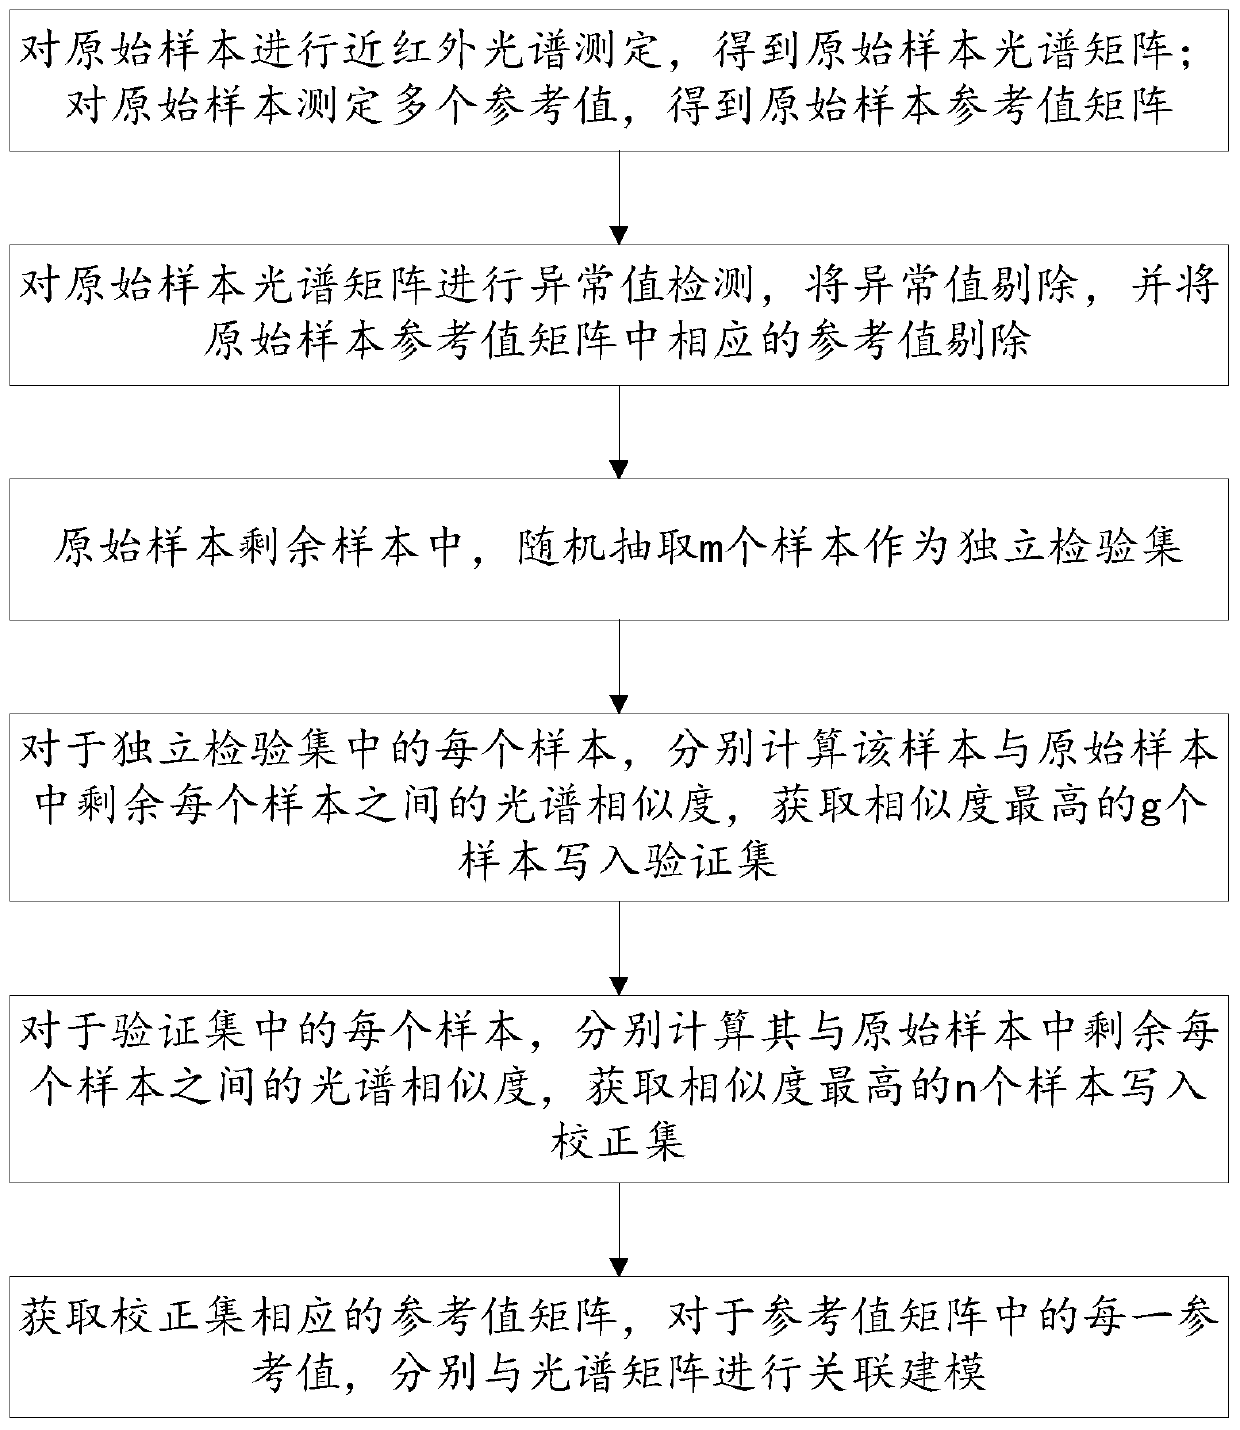
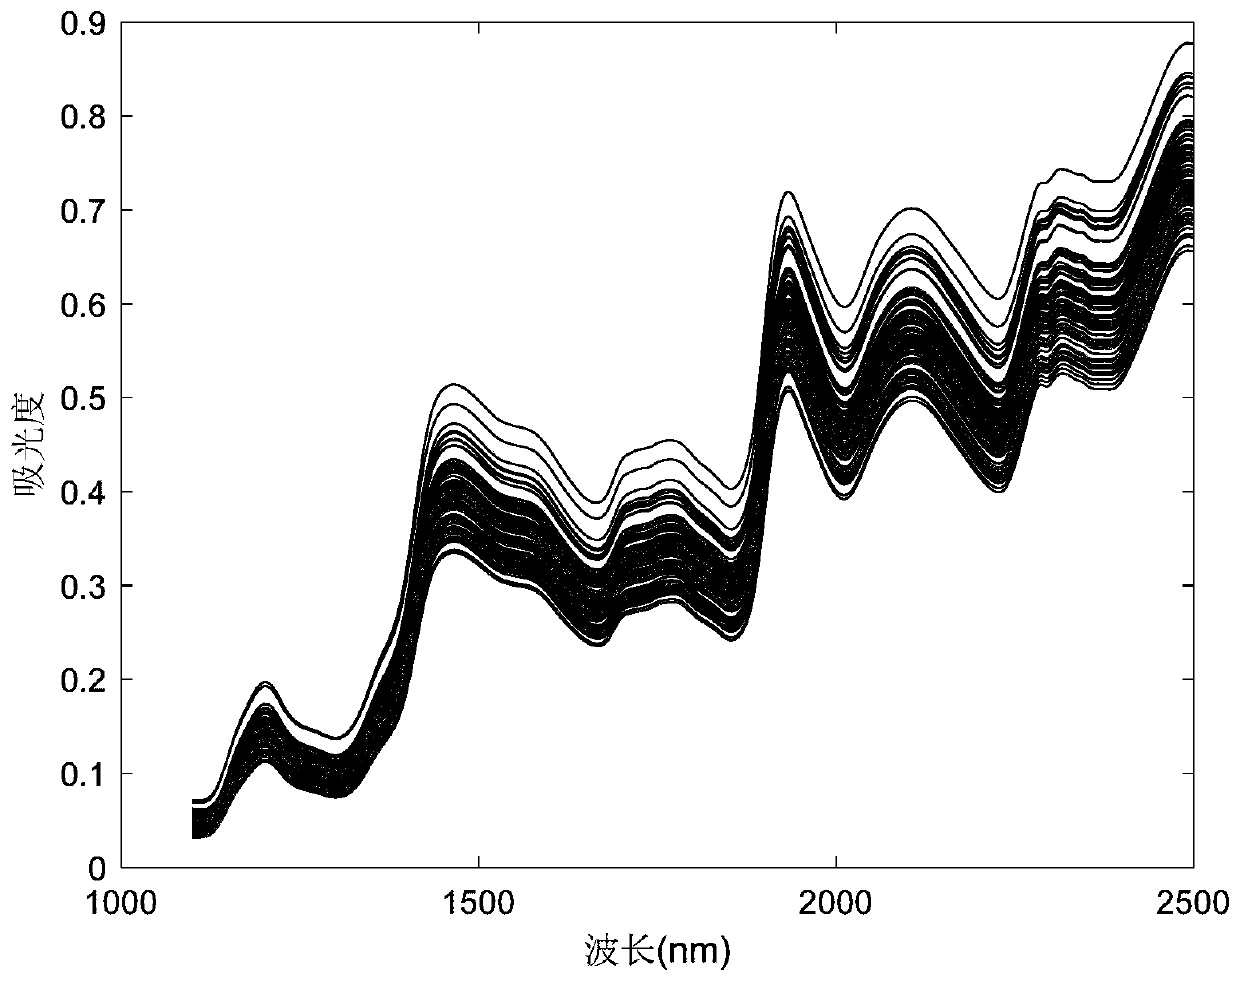
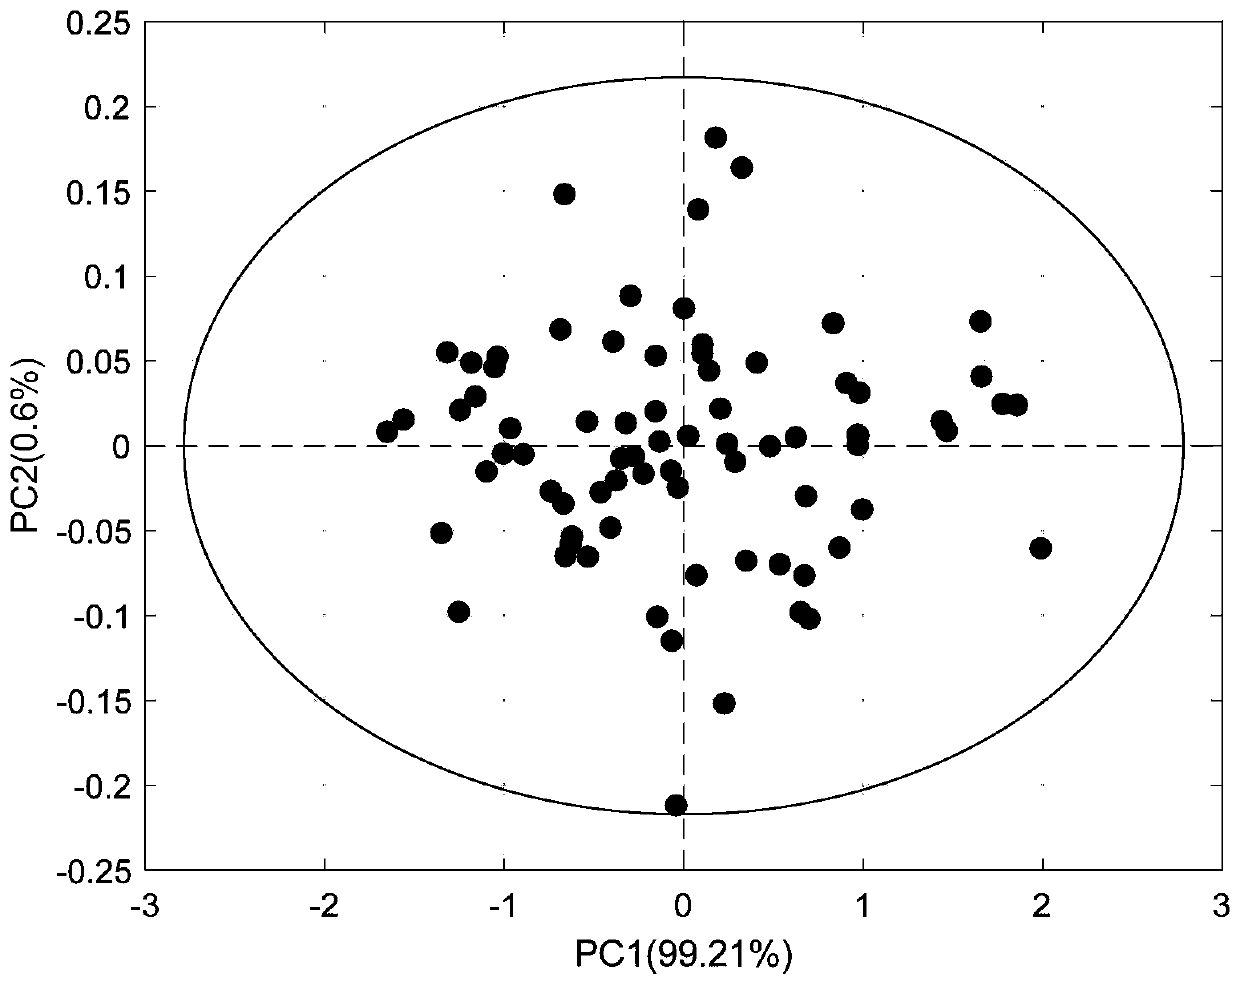
[0098] Taking Salvia miltiorrhiza as an example, a total of 120 samples were tested, including the repetition of samples. X is the near-infrared spectrum matrix of the sample, measured by a Fourier transform near-infrared spectrometer (AntarisⅡ, Thermo Fisher, USA), and Y is the matrix of four quality indicators, namely tanshinone ⅡA (TSⅡA), cryptotanshinone (CTS), tanshinone Ⅰ (TS Ⅰ), salvianolic acid B (SAB), the original spectrum of the sample can be found in Figure 6 . Each component is the detection object, and the new classification method is evaluated. In the following description, tanshinone IIA is taken as an example, and the same steps are taken for other components. First remove the abnormal samples, through Hotelling T 2 method, 3 abnormal samples were detected, and 117 samples remained after elimination. The principal component analysis diagram after removing the abnormal values is shown in Figure 7 . Randomly select 15 samples as an independent test set X...
Embodiment 3
[0116] Taking the public data corn as an example, there are 80 samples tested. X is the near-infrared spectrum matrix of the sample, and Y is the matrix of four component quality indicators. Take water as the object description, and take the same steps for the rest of the ingredients, first remove the abnormal samples, and use Hotelling T 2 method, 3 abnormal samples are detected, and then a total of 77 samples are left after elimination, and 10 samples are randomly selected as an independent test set X t .
[0117] To divide the remaining 67 samples, we changed the number of validation set samples to investigate the impact of various division methods on the performance of the model after changing the number of validation set samples. Among them, for each independent test set sample, select 2 (that is, g=2) samples with the closest Euclidean distance to be included in the verification set. The number of samples in the verification set is between 14 and 20, and the remaining ...
PUM
 Abstract
Description
Claims
Application Information
 - R&D
- Intellectual Property
- Life Sciences
- Materials
- Tech Scout
- Unparalleled Data Quality
- Higher Quality Content
- 60% Fewer Hallucinations
Browse by: Latest US Patents, China's latest patents, Technical Efficacy Thesaurus, Application Domain, Technology Topic, Popular Technical Reports.
© 2025 PatSnap. All rights reserved.Legal|Privacy policy|Modern Slavery Act Transparency Statement|Sitemap|About US| Contact US: help@patsnap.com


