Voltage sag monitoring device configuration method considering dynamic network reconfiguration (DNR)
A monitoring device and dynamic reconfiguration technology, applied in measurement devices, circuit devices, AC network circuits, etc., can solve problems such as reducing the observability of voltage sags, and achieve the effect of high engineering application value
- Summary
- Abstract
- Description
- Claims
- Application Information
AI Technical Summary
Problems solved by technology
Method used
Image

Examples
Embodiment Construction
[0041] The present invention will be further described in detail below in conjunction with the accompanying drawings and specific embodiments.
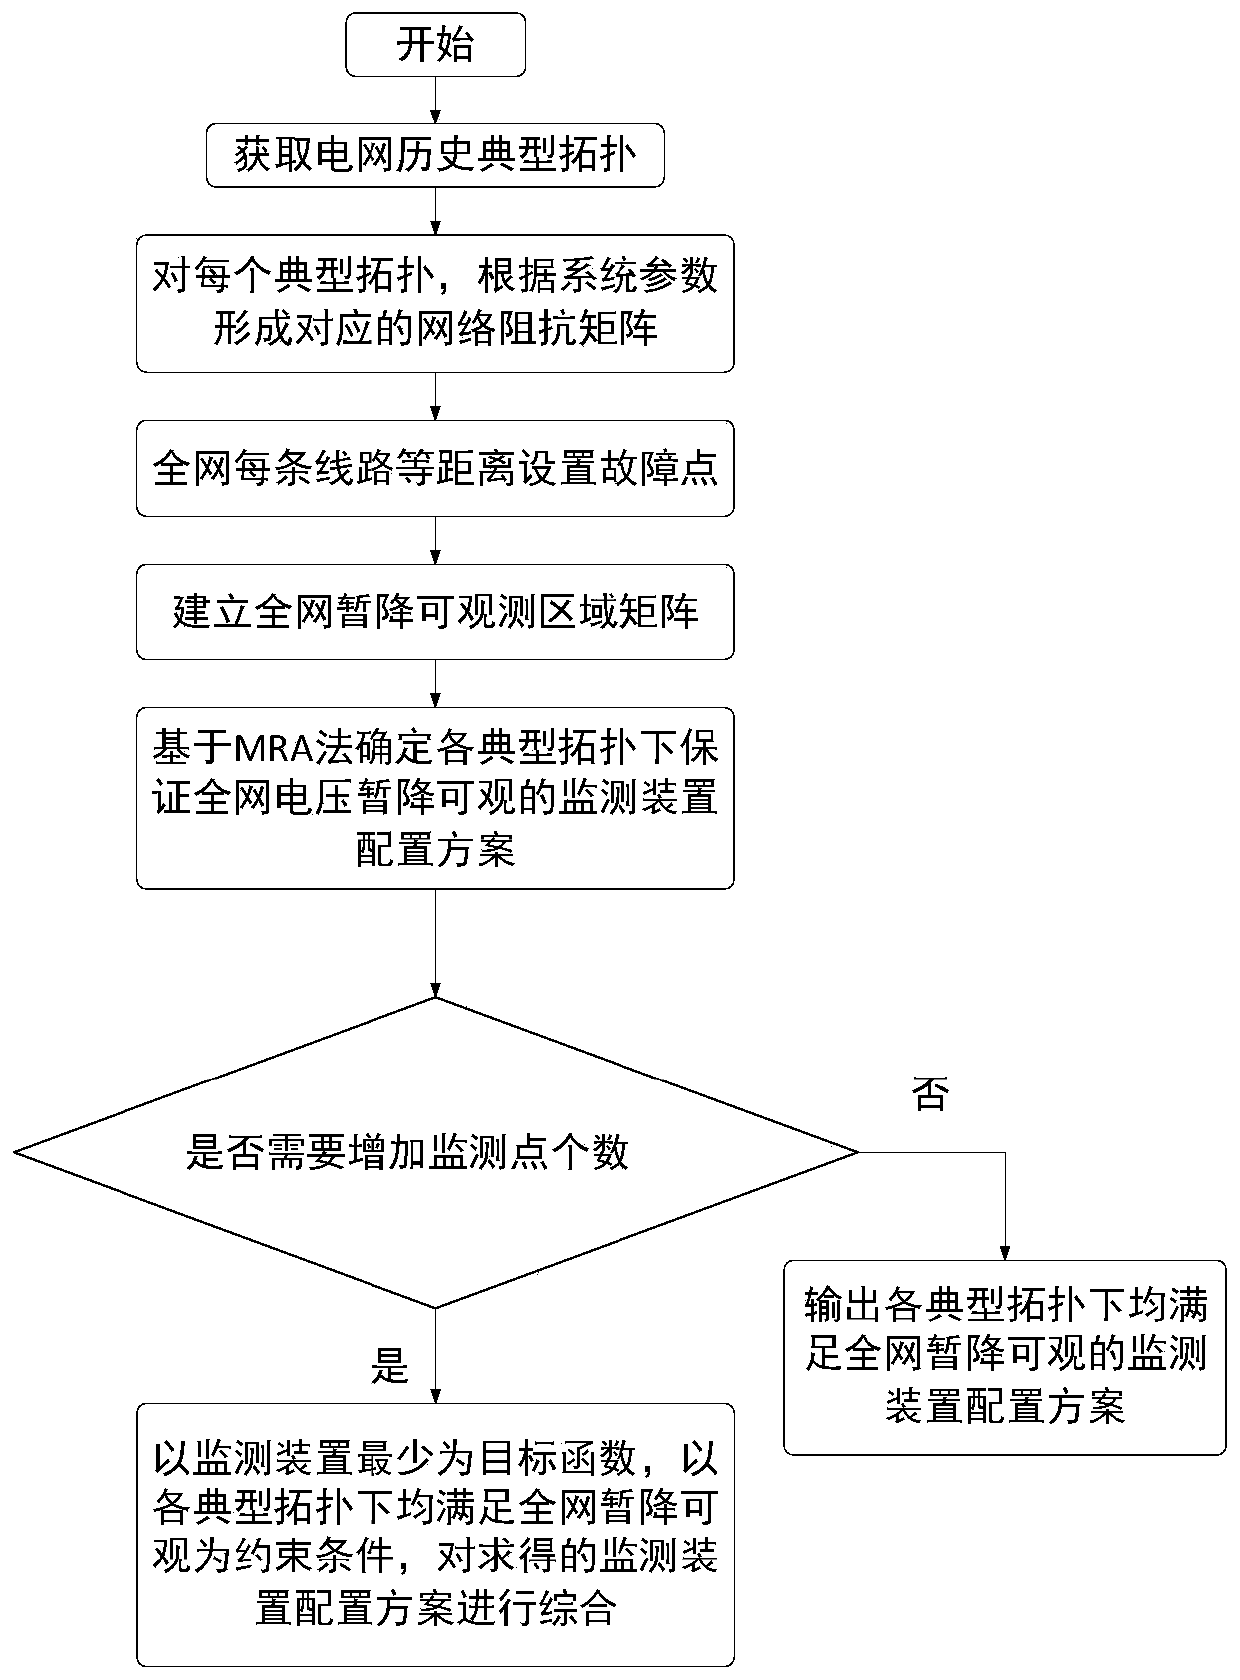
[0042]As the economic loss of production caused by voltage sag is becoming more and more serious, it is necessary to install a voltage sag monitoring device. However, due to cost issues, it is not necessary to install voltage sag monitoring devices on all buses. Therefore, it is of engineering significance to study the optimal configuration of voltage sag monitoring devices. Existing studies are all carried out under a certain power grid topology when optimizing the configuration of monitoring points. But the actual situation is that the application of DNR will directly affect the change of the network topology, resulting in the change of the impedance matrix of the power grid, and the formula of short-circuit calculation also needs to be changed accordingly, which may reduce the observability of voltage sag. The invention is a meth...
PUM
 Abstract
Description
Claims
Application Information
PatSnap Eureka turns technology decisions into work you can execute. Powered by our Innovation Knowledge Graph, it runs expert workflows across engineering, life sciences, materials and intellectual property. Get your review-ready output in minutes.


