Shale gas sweet spot prediction method based on multiple linear regression analysis

A technique of multiple linear regression and prediction method, applied in the field of shale gas, it can solve the problems of not considering the weight, unable to judge the change of the sweet spot area or trend, and poor comparability of the results, so as to avoid the subjective judgment error and the sequential area display is intuitive. , the effect of distribution position refinement

Active Publication Date: 2020-04-21
中国地质调查局成都地质调查中心
View PDF8 Cites 7 Cited by
  • Summary
  • Abstract
  • Description
  • Claims
  • Application Information

AI Technical Summary

Problems solved by technology

It can be seen that the existing North American shale evaluation methods are difficult to meet the prediction of marine shale sweet spots.
[0004] In addition, the currently existing methods for evaluation of sweet spot geological parameters and optimization of sweet spot areas all have problems such as qualitative description, simple subjective assignment and scoring, multi-parameter comprehensive evaluation only through simple superposition, and single preservation condition index evaluation, which is difficult to quantify.
This makes it difficult to quantify the geological characteristic parameters during the prediction process, and the prediction results of the superposition method are not comparable; at the same time, the weight of the impact of each geological characteristic parameter on the gas content is not considered, and the prediction plan obtained by the superposition method cannot judge the study area. A change in sweet spot area or trend within

Method used


Image

  • Shale gas sweet spot prediction method based on multiple linear regression analysis
  • Shale gas sweet spot prediction method based on multiple linear regression analysis
  • Shale gas sweet spot prediction method based on multiple linear regression analysis

Examples


Embodiment

[0080] This example provides a shale gas sweet spot prediction method based on multiple linear regression analysis. According to the basic characteristics of shale gas reservoirs, combined with the geological characteristics of the Sichuan Basin and its surrounding areas, guided by the characteristics of geological parameters, by comparing multiple linear Regression analysis is used to identify and predict the "sweet spots" of shale gas.

[0081] It includes the following steps:

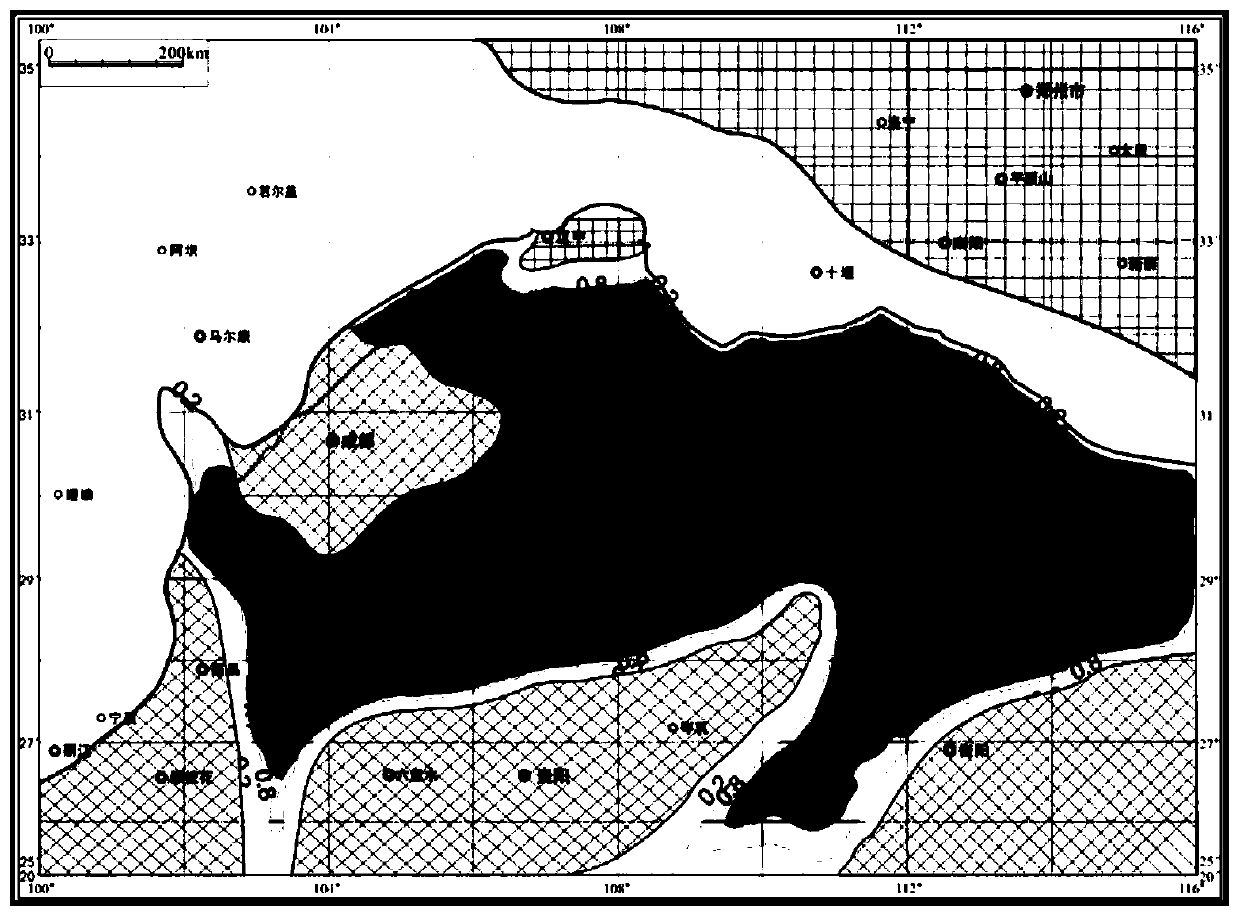
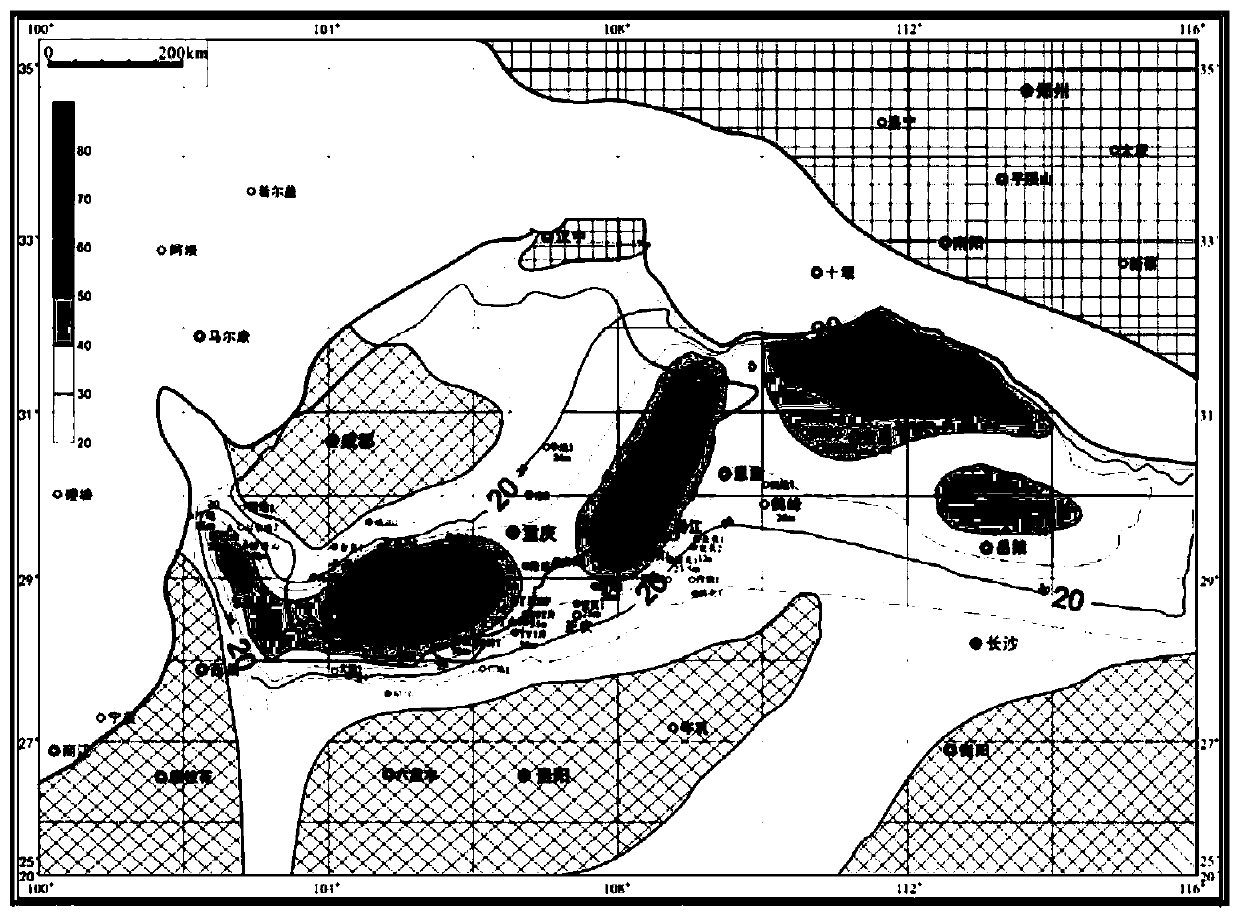
[0082] A. Collect the shale gas geological characteristic parameter information of shale gas drilling in the Sichuan Basin and its surrounding area, and obtain the shale geological parameters in the Sichuan Basin and its surrounding area, as shown in Table 2, and then quantify each geological parameter into a plane distribution map;

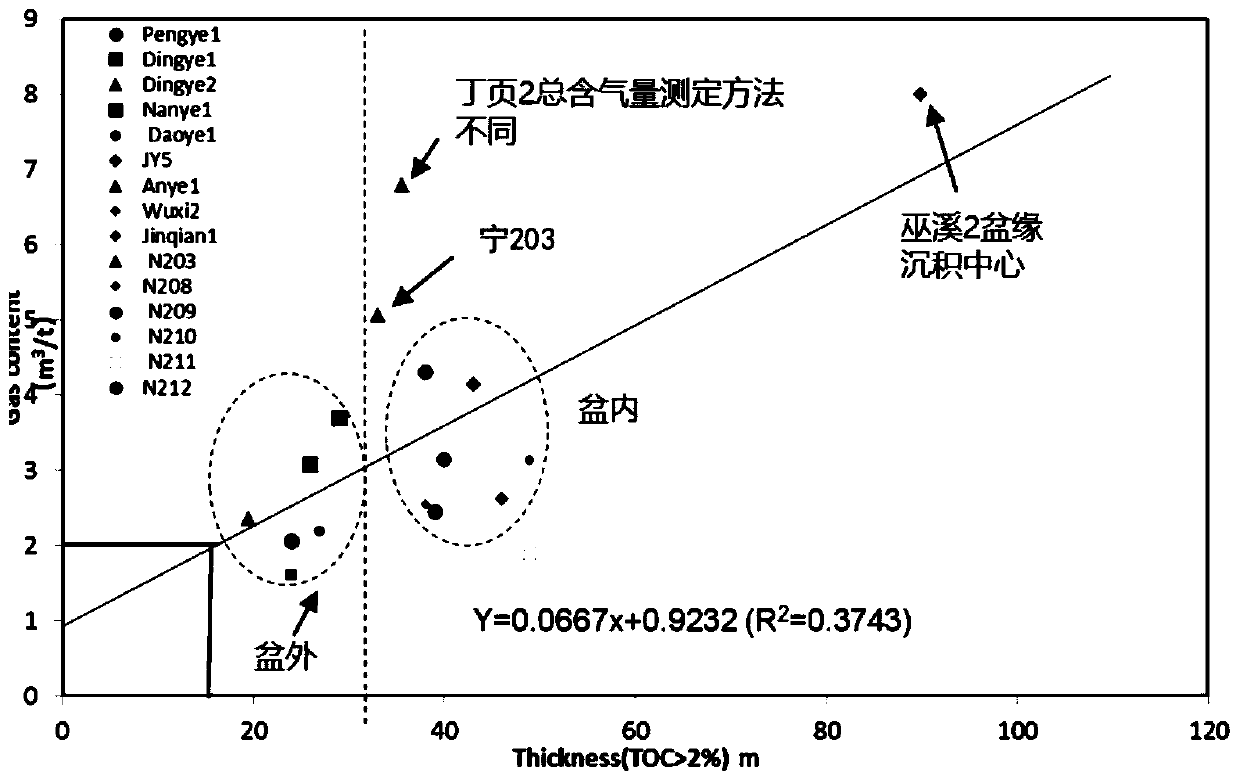
[0083] B. With gas content as the dependent variable and other geological parameters as independent variables, perform linear regression fitting on each geological para...


PUM


Abstract

The invention provides a shale gas sweet spot prediction method based on multiple linear regression analysis, and belongs to the field of shale gas. The method comprises the following steps: acquiringreservoir desserts, and storing various geological parameters in the desserts and pressure coefficient desserts, evaluating geological characteristic parameters related to the gas content of the shale gas; and performing quantizing into a planar distribution map, carrying out linear regression fitting on each geological characteristic parameter and the gas content; obtaining a regression equationof each geologic characteristic parameter and the gas content, taking the weight of each geologic characteristic parameter as the correlation coefficient of the corresponding regression equation, andobtaining the shale gas sweet spot prediction model of the shale reservoir of a to-be-explored area after quantitative superposition according to the measured value of each geologic characteristic parameter and the corresponding weight. The dessert distribution positions obtained through the prediction method are more refined and accurate, the dessert sequence area is displayed more visually, andsubjective judgment errors caused by simple image layer superposition are avoided.

Description

technical field [0001] The invention relates to the field of shale gas, in particular to a method for predicting shale gas sweet spots based on multiple linear regression analysis. Background technique [0002] Rich shale gas resources are expected to alleviate the energy crisis we are facing. However, due to the complexity of shale formations, its exploration and development are difficult, and the cost of shale gas drilling is much higher than that of conventional oil drilling. This requires accurate prediction and identification of "sweet spot" potential areas for future exploration when developing shale gas reservoirs. [0003] According to Jarvie et al. (2007), the reference indicators for shale sweet spots in North America are mainly static parameters, including three types: shale distribution (burial depth, shale thickness and lateral distribution, and fracture distribution); shale composition (organic matter type and abundance, clay minerals, brittle minerals); shal...

Claims


Application Information

Patent Timeline
Patent Type & Authority Applications(China)
IPC IPC(8): G06F30/20G06Q10/04G06Q50/02
CPCG06Q10/04G06Q50/02Y02A10/40
Inventor 余谦赵安坤张娣张茜雷子慧周业鑫
Owner 中国地质调查局成都地质调查中心
Why Eureka
Try Eureka