Data visualization design platform dragged by heterogeneous data source

A technology of heterogeneous data sources and data sources, applied in the input/output process of data processing, software design, electrical digital data processing, etc., can solve the problems of long time consumption, limited content and effect, and long response speed. To achieve the effect of reducing the difficulty of construction

Pending Publication Date: 2020-10-30
TAIJI COMP
View PDF0 Cites 19 Cited by
  • Summary
  • Abstract
  • Description
  • Claims
  • Application Information

AI Technical Summary

Problems solved by technology

[0003] The reports displayed by the traditional data display system are relatively static, and the corresponding models are modeled by IT personnel in advance according to the analysis requirements. If the requirements change, the business personnel cannot direct

Method used


Image

  • Data visualization design platform dragged by heterogeneous data source
  • Data visualization design platform dragged by heterogeneous data source

Examples


Embodiment Construction

[0022] The following will clearly and completely describe the technical solutions in the embodiments of the present invention with reference to the accompanying drawings in the embodiments of the present invention. Obviously, the described embodiments are only some, not all, embodiments of the present invention. All other embodiments obtained by persons of ordinary skill in the art based on the embodiments of the present invention belong to the protection scope of the present invention.

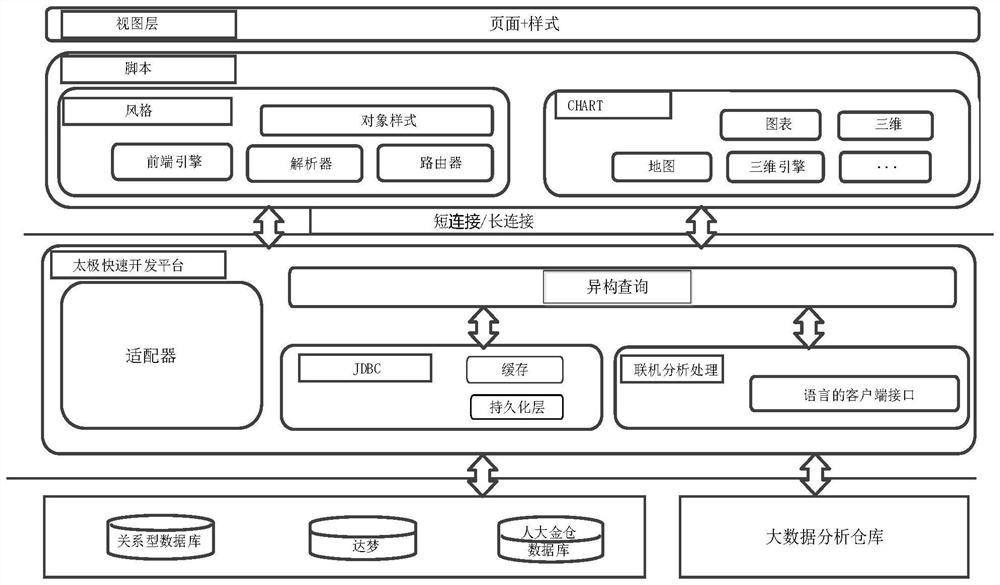
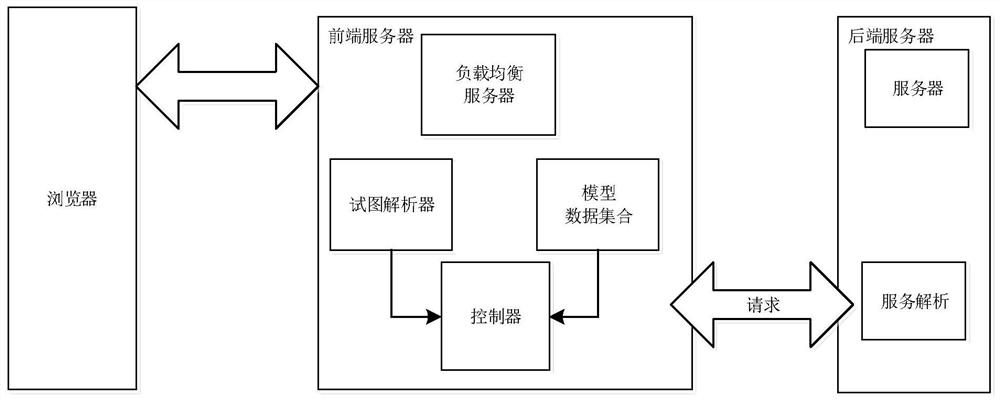
[0023] As shown in Figure 1-2, according to the heterogeneous data source drag-and-drop data visualization design platform described in the embodiment of the present invention, the platform includes a visualization unit and a heterogeneous data source access unit;

[0024] The visualization unit includes rich visualization charts, professional visualization templates, multi-source data access, multi-resolution large-screen adaptation and application visualization interaction. The visualization...


PUM


Abstract

The invention discloses a data visualization design platform dragged by a heterogeneous data source. The platform comprises a visualization unit. The visualization unit comprises rich visualization charts, professional visualization templates, multi-source data access, multi-resolution large screen adaptation and application visualization interaction, and the visualization unit adopts a dragging type custom arrangement mode to realize various interactive data display boards, data large screens and diversified and cool data visualization page design. The heterogeneous data source access unit comprises a data adaptation unit, a data monitoring unit, a visual editing unit and a visual output unit. The heterogeneous data source access unit integrates all related service data based on heterogeneous data source integration, manages and monitors the accessed data source, realizes the layout of a large screen through a simple dragging mode, and displays the large screen to a user through multiple terminals in a visual interaction mode. The platform has the beneficial effects that the heterogeneous data source can be quickly accessed, and the visual data platform can be quickly built in a configuration and dragging manner.

Description

technical field [0001] The invention relates to the technical field of data visualization platforms, in particular to a data visualization design platform for dragging heterogeneous data sources. Background technique [0002] With the rapid development of information technology, big data has made it possible to process massive data and greatly reduced the cost of data storage and processing. With the advent of the era of big data, the large-screen display system is no longer just a display tool, but To transmit images and data signals to the large screen and display them to users, it is necessary to efficiently analyze massive data information, realize the perfect combination of hardware and software, help managers discover the relationship and laws behind the data, and provide information for decision-making. in accordance with. [0003] The reports displayed by the traditional data display system are relatively static, and the corresponding models are modeled by IT person...

Claims


Application Information

Patent Timeline
IPC IPC(8): G06F8/20G06F8/34G06F3/0486
CPCG06F8/24G06F8/34G06F3/0486
Inventor 迟雪
Owner TAIJI COMP
Why Eureka
Try Eureka