Spatial autocorrelation clustering method for remote correlation mode

A technology of spatial autocorrelation and correlation pattern, applied in character and pattern recognition, instruments, data processing applications, etc., to achieve the effect of facilitating horizontal comparison

Pending Publication Date: 2020-12-01
SUN YAT SEN UNIV
View PDF7 Cites 0 Cited by
  • Summary
  • Abstract
  • Description
  • Claims
  • Application Information

AI Technical Summary

Problems solved by technology

However, for the teleconnection model measured by the correlation coefficient, the coefficient itself has standardized properties, and the commonly used LISA indicators such as the Moran index, according to the definition described in Chapter 4 of "Econometric Geography", the calculation process will be Variables are standardized, so the results obtained can only reflect the relative distribution of high and low values ​​at the same time and indicators, and it is difficult to make horizontal comparisons of calculation results at different times or indicators

Method used


Image

  • Spatial autocorrelation clustering method for remote correlation mode
  • Spatial autocorrelation clustering method for remote correlation mode
  • Spatial autocorrelation clustering method for remote correlation mode

Examples


Embodiment 1

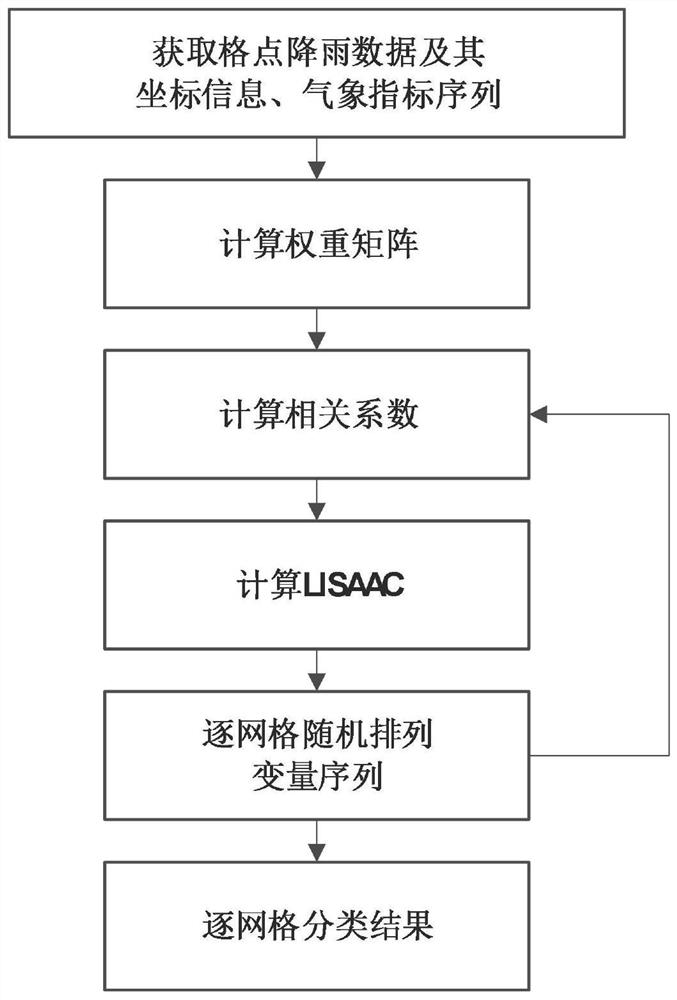
[0051] Such as figure 1 As shown, a spatial autocorrelation clustering method for teleconnection mode, including the following steps:

[0052] S1: Obtain the spatial grid coordinate information of the research area, and calculate the spatial weight matrix according to the coordinate information;

[0053] S2: Obtain grid-scale rainfall data in the study area and large-scale meteorological factor indicators in the same time range, and obtain the time series of rainfall-meteorological indicators;

[0054] S3: According to the obtained time series of rainfall-meteorological indicators, calculate the correlation coefficient r of rainfall-meteorological indicators grid by grid;

[0055] S4: Calculate the grid-by-grid spatial autocorrelation local index LISAAC according to the correlation coefficient r and the spatial weight matrix;

[0056] S5: Rearrange the time series of rainfall and meteorological indicators in step S2 to obtain a new time series of rainfall-meteorological indi...

Embodiment 2

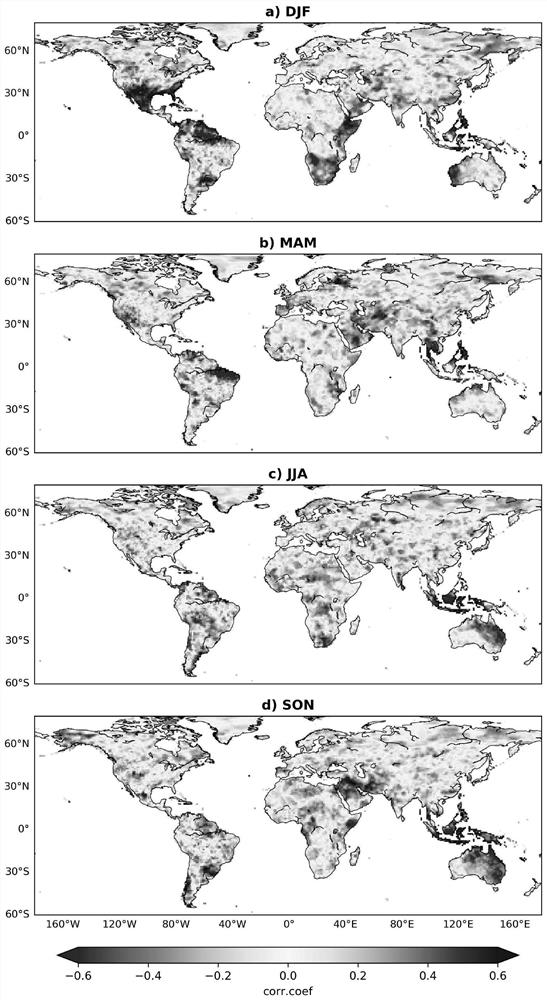
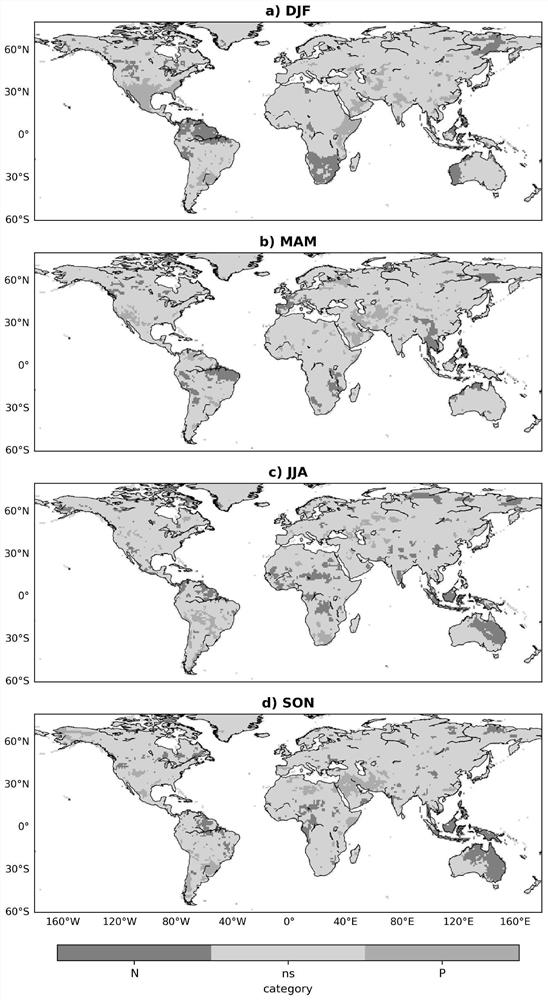
[0085] More specifically, on the basis of Example 1, this example illustrates the effect of the method through experiments, using the US Climate Prediction Center (CPC) 1982-2010 global seasonal grid precipitation data and Take the indicator as an example, calculate the spatial autocorrelation clustering of the El Niño-Southern Oscillation (ENSO) and the global seasonal precipitation teleconnection model, take the significance level α as 0.10 as an example, calculate LISAAC, and compare the grid without considering the spatial autocorrelation Significance classification results and results calculated using local Moran indices.

[0086] Such as figure 2 as shown, figure 2 The spatial distribution of teleconnection coefficients in the northern hemisphere in winter, spring, summer and autumn (denoted as DJF, MAM, JJA and SON, respectively) is given. If the spatial autocorrelation relationship is not considered, and only the significance of the correlation coefficient of the ...


PUM


Abstract

The invention provides a spatial autocorrelation clustering method for a remote correlation mode. According to the method, the correlation degree of each space grid unit and an adjacent unit is considered; the method is based on local Moran index definition. A correlation coefficient original numerical value is adopted, and centralization processing is not carried out. Therefore, a local Moran index calculation formula is improved, a new spatial autocorrelation local index LISAAC is obtained, the detection of a significant positive or negative remote correlation aggregation range is realized,and meanwhile, the recognition of abnormal values (i.e., non-significant or negative grids appear in a significant positive value region and non-significant or positive grids appear in a significant negative value region) is realized. Experimental results show that spatial clustering of different types of remote correlation can be realized according to the standardization property of the remote correlation coefficient, and the results are convenient for transverse comparison of remote correlation degrees in different seasons.

Description

technical field [0001] The invention relates to the field of meteorology and climatology, and more specifically, to a space autocorrelation clustering method oriented to a teleconnection model. Background technique [0002] The relationship between large-scale meteorological factors and precipitation anomalies around the world has always been paid attention to, and the strength and mode of this teleconnection can be quantified by using the relevant meteorological factor indicators and the correlation coefficients of monthly or seasonal precipitation in various places. However, in actual calculation, the precipitation in adjacent areas is often not independent, but there is a strong correlation. In order to detect this kind of spatial autocorrelation, the local index of spatial autocorrelation (LISA) is often used for spatial autocorrelation analysis to detect whether there is information about the spatial pattern of variables. However, for the teleconnection model measured ...

Claims


Application Information

Patent Timeline
Patent Type & Authority Applications(China)
IPC IPC(8): G06K9/62G06Q10/06G06Q50/26
CPCG06Q10/06393G06Q50/26G06F18/23G06F18/24G06F16/906G06F16/9537
Inventor 赵铜铁钢陈浩玲
Owner SUN YAT SEN UNIV
Why Eureka
Try Eureka