An Analysis Method of Encoder Error Source Based on Spectrum Analysis
An analysis method, a technology of frequency spectrum analysis, applied in the direction of instruments, etc., can solve the problems of not knowing the contribution of encoder errors, not being able to obtain various error sources, and inconvenient encoder upgrades or maintenance, etc., to achieve convenient operation and use Good effect, the effect of improving work efficiency
- Summary
- Abstract
- Description
- Claims
- Application Information
AI Technical Summary
Problems solved by technology
Method used
Image
Examples
Embodiment 1
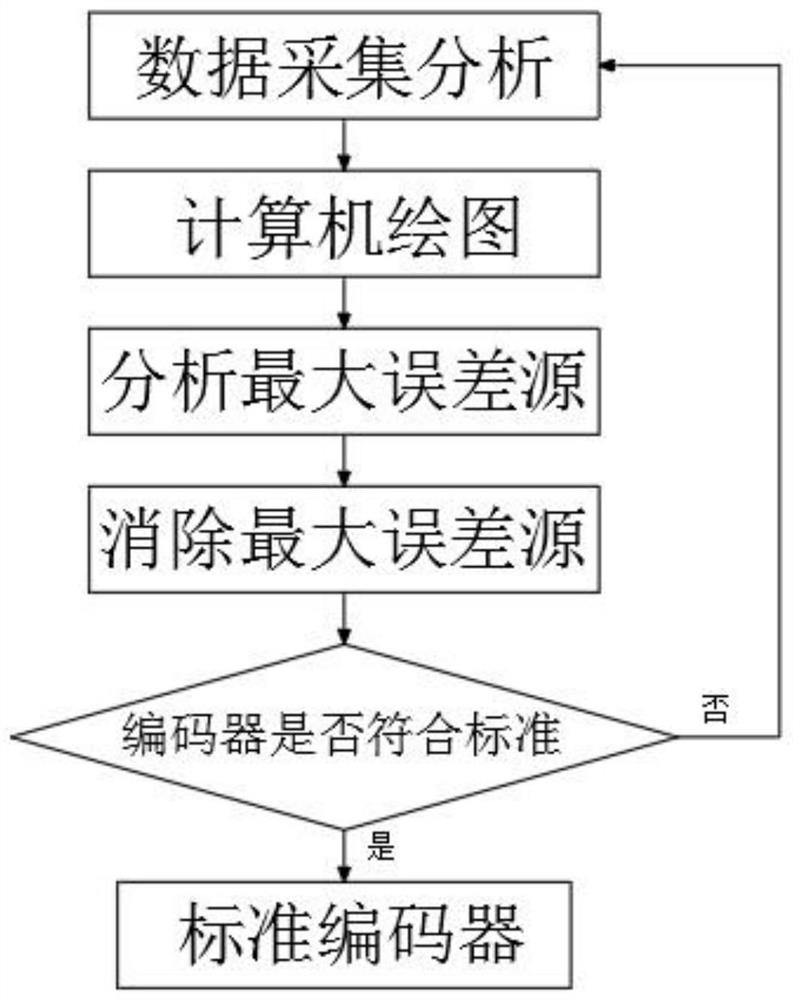
[0032] A kind of encoder error source analysis method based on frequency spectrum analysis, comprises the following steps:
[0033] ①. Data collection and analysis: Obtain the data of the tested encoder through the encoder error measurement device, and input the data into the computer for analysis;
[0034] ②. Computer graphics: the computer makes error curves and error spectrum diagrams for the data, and defines the error spectrum;
[0035] Obtain the error amplitude of the encoder in each cycle frequency according to the error spectrogram, and judge the maximum error factor of the encoder, that is, the maximum error source of the encoder;
[0036] The ordinate of the error graph is the error value of the encoder under test, which is the standard value of the turntable minus the measurement value of the encoder under test, and the abscissa of the error graph is the angle of the turntable.
[0037] The computer makes an error curve graph and an error spectrum graph for the da...
Embodiment 2
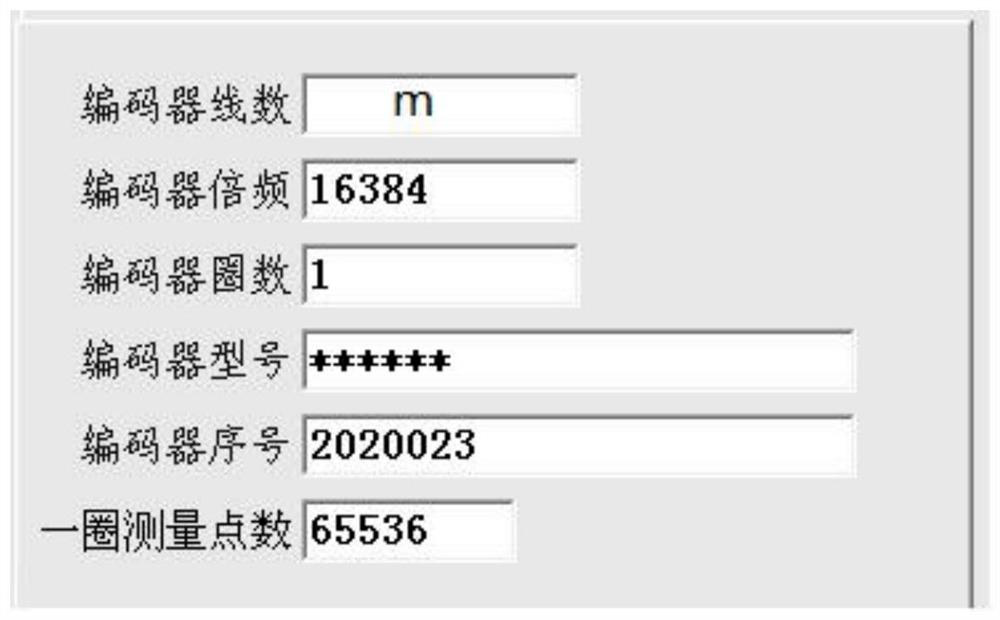
[0053] An example of the detection, debugging, re-testing, and re-debugging process of an encoder: the number of lines of the encoder is m lines, and the number of points collected by the precision angle measuring turntable in the range of 0-360° is 65536, and the detection time is 0.5 minutes ( RPM=2), input parameters such as figure 2 Shown:
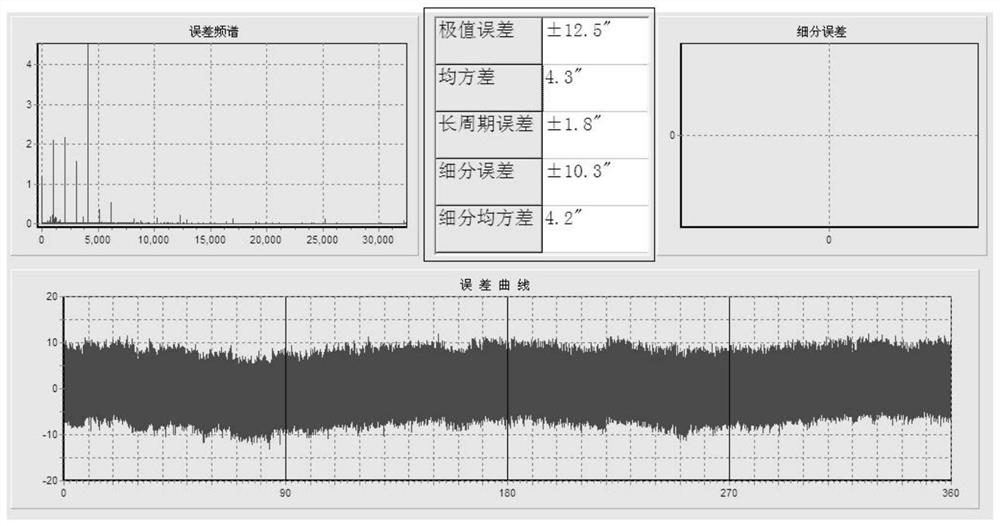
[0054] Start detection and generate error graphs, such as image 3 As shown, the error value of the tested encoder on the ordinate of the error curve is the standard value of the turntable minus the measured value of the tested encoder; the error curve shows the extreme error and the average error, and the position error ∆φ can be expressed as ,in Represents the angle value measured by the measuring standard instrument, Represents the angle value of the encoder under test.
[0055] image 3The vertical axis of the curve in the error curve is ∆φ, unit arc second, the horizontal axis is the encoder position value, the range is 0...
PUM
 Abstract
Description
Claims
Application Information
 - R&D
- Intellectual Property
- Life Sciences
- Materials
- Tech Scout
- Unparalleled Data Quality
- Higher Quality Content
- 60% Fewer Hallucinations
Browse by: Latest US Patents, China's latest patents, Technical Efficacy Thesaurus, Application Domain, Technology Topic, Popular Technical Reports.
© 2025 PatSnap. All rights reserved.Legal|Privacy policy|Modern Slavery Act Transparency Statement|Sitemap|About US| Contact US: help@patsnap.com


