Visual chart generation method and device, electronic equipment and storage medium
A chart and chart type technology, applied in the field of data visualization, can solve the problems of high maintenance cost and poor flexibility, and achieve the effect of reducing maintenance cost, improving user experience, and improving convenience and flexibility
- Summary
- Abstract
- Description
- Claims
- Application Information
AI Technical Summary
Problems solved by technology
Method used
Image
Examples
Embodiment 1
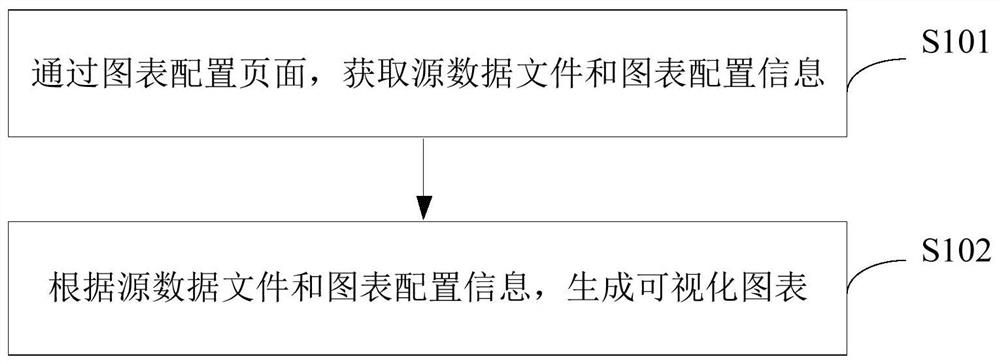
[0041] figure 1 It is a schematic flowchart of the method for generating a visual chart provided in Embodiment 1 of the present application. The method of this embodiment can be executed by the device for generating a visual chart provided in the embodiment of the present application. The device can be implemented by software and / or hardware, and It can be integrated into electronic devices such as terminals. Such as figure 1 As shown, the visualization chart generation method of this embodiment includes:
[0042] S101. Obtain source data files and chart configuration information through the chart configuration page.
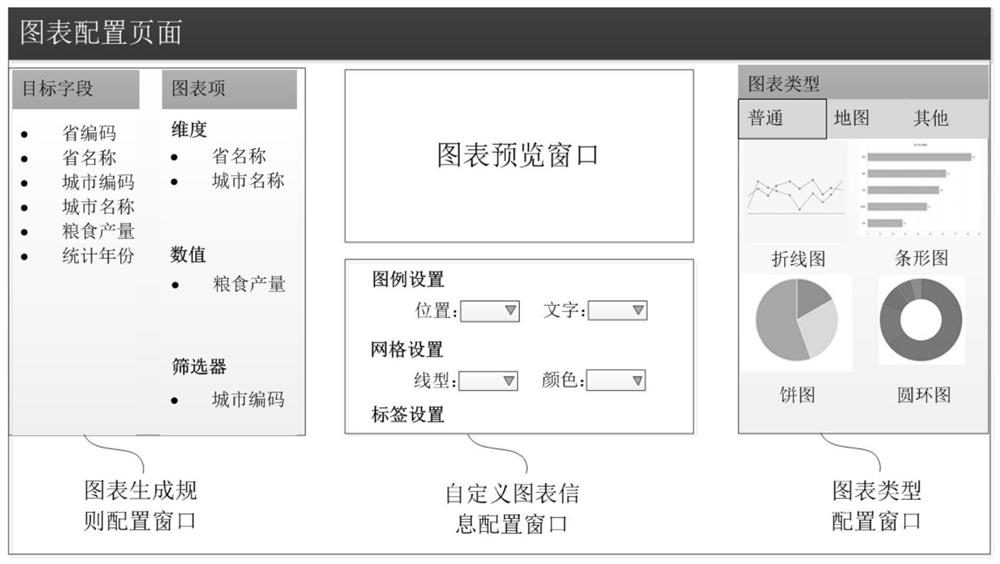
[0043] In this embodiment, a chart configuration page for generating a visualization chart is provided. Specifically, the user can enter the chart configuration page by entering a specified URL in a browser, and according to the guide or relevant content provided by the chart configuration page, Perform a series of operations, such as uploading source data fi...
Embodiment 2
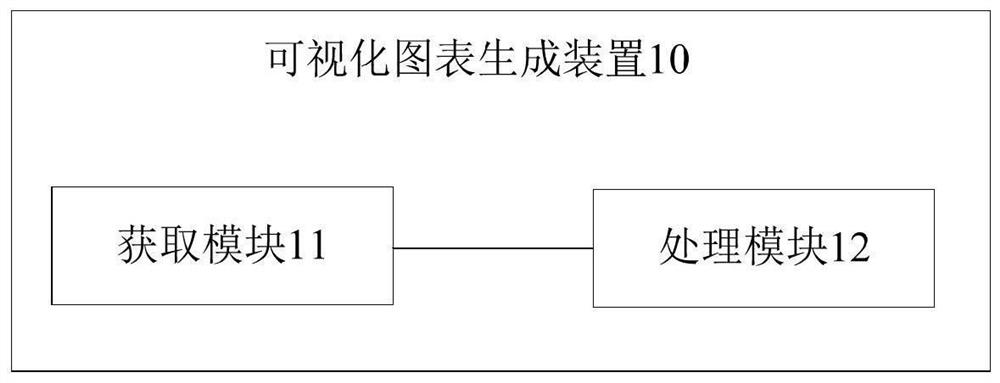
[0066] image 3 Schematic diagram of the structure of the visualization chart generating device provided for Embodiment 2 of the present application, as shown in image 3 As shown, the visualization chart generation device 10 in this embodiment includes:
[0067] An acquisition module 11 and a processing module 12.
[0068] The acquiring module 11 is configured to acquire source data files and chart configuration information through a chart configuration page; wherein, the chart configuration information includes at least one of chart types, chart generation rules and custom chart information;
[0069] The processing module 12 is configured to generate a visualized chart according to the source data file and the chart configuration information.
[0070] Optionally, the acquiring module 11 is specifically used for:
[0071] Obtain the source data file through the file acquisition interface provided by the chart configuration page, and the file acquisition interface includes ...
Embodiment 3
[0089] Figure 4 A schematic structural diagram of an electronic device provided in Embodiment 3 of the present application, such as Figure 4 As shown, the electronic device 20 includes a memory 21, a processor 22, and a computer program stored in the memory and operable on the processor; the number of processors 22 in the electronic device 20 may be one or more, Figure 4 Take a processor 22 as an example; the processor 22 and memory 21 in the electronic device 20 can be connected by bus or other methods, Figure 4 Take connection via bus as an example.
[0090]As a computer-readable storage medium, the memory 21 can be used to store software programs, computer-executable programs and modules, such as program instructions / modules corresponding to the acquisition module 11 and the processing module 12 in the embodiment of the present application. The processor 22 executes various functional applications and data processing of the device / terminal / server by running the softwa...
PUM
 Abstract
Description
Claims
Application Information
 - R&D
- Intellectual Property
- Life Sciences
- Materials
- Tech Scout
- Unparalleled Data Quality
- Higher Quality Content
- 60% Fewer Hallucinations
Browse by: Latest US Patents, China's latest patents, Technical Efficacy Thesaurus, Application Domain, Technology Topic, Popular Technical Reports.
© 2025 PatSnap. All rights reserved.Legal|Privacy policy|Modern Slavery Act Transparency Statement|Sitemap|About US| Contact US: help@patsnap.com


