Supercharge Your Innovation With Domain-Expert AI Agents!

Label follow-up visualization report generation system and method based on WebGL

A report generation and labeling technology, which is applied in manufacturing computing systems, 3D image processing, network data browsing optimization, etc., can solve the lack of support for MAC and Linux systems, it is difficult to achieve full compatibility of clients, and only supports image models, etc. problems, to improve user experience, reduce intervention, and increase accuracy

Active Publication Date: 2021-02-02
易思维(杭州)科技有限公司
View PDF4 Cites 0 Cited by
  • Summary
  • Abstract
  • Description
  • Claims
  • Application Information

AI Technical Summary

Problems solved by technology

Most of the visual process reports on the BS side can only support the configuration of reports using image models. The basic structure is as follows: figure 2 shown
[0003] Although the existing non-web-side visual process report uses OpenGl-based 3D technology, it requires users to install the client in advance, which is cumbersome to use; on the other hand, it is difficult for the client to do all the cross-system processing Compatible, usually only supports Windows system, there is a lack of support for MAC and Linux systems
[0004] However, most of the existing web-side visual process reports can only support image models. When configuring the visual process report (the test results corresponding to each measurement point are presented in the external label), on the one hand, it is necessary to prepare a large number of Image model; on the other hand, it is necessary to manually judge the position of the measurement point on the image model, and associate the measurement point with its corresponding label through repeated manual drawing to complete the report configuration
This method not only has a large workload, but also has the problem of inaccurate judgment of the position of the measurement point by humans

Method used


Image

  • Label follow-up visualization report generation system and method based on WebGL
  • Label follow-up visualization report generation system and method based on WebGL
  • Label follow-up visualization report generation system and method based on WebGL

Examples


Embodiment Construction

[0022] The technical solutions of the present invention will be described in detail below in conjunction with the accompanying drawings and specific embodiments.

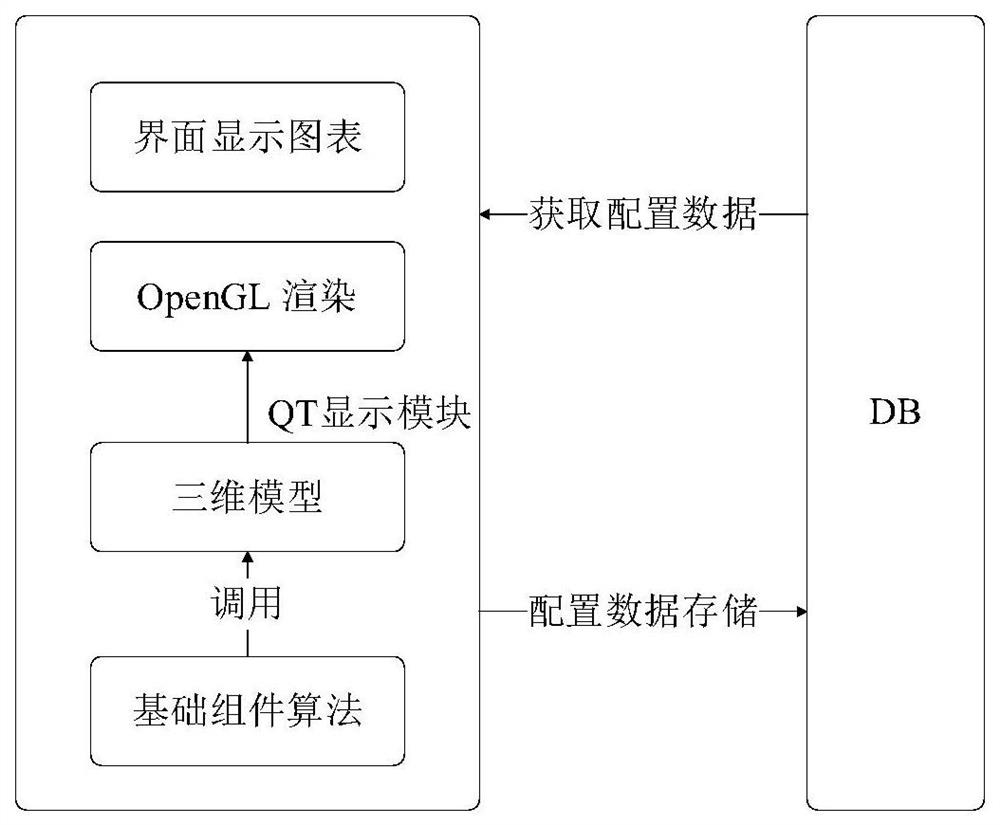
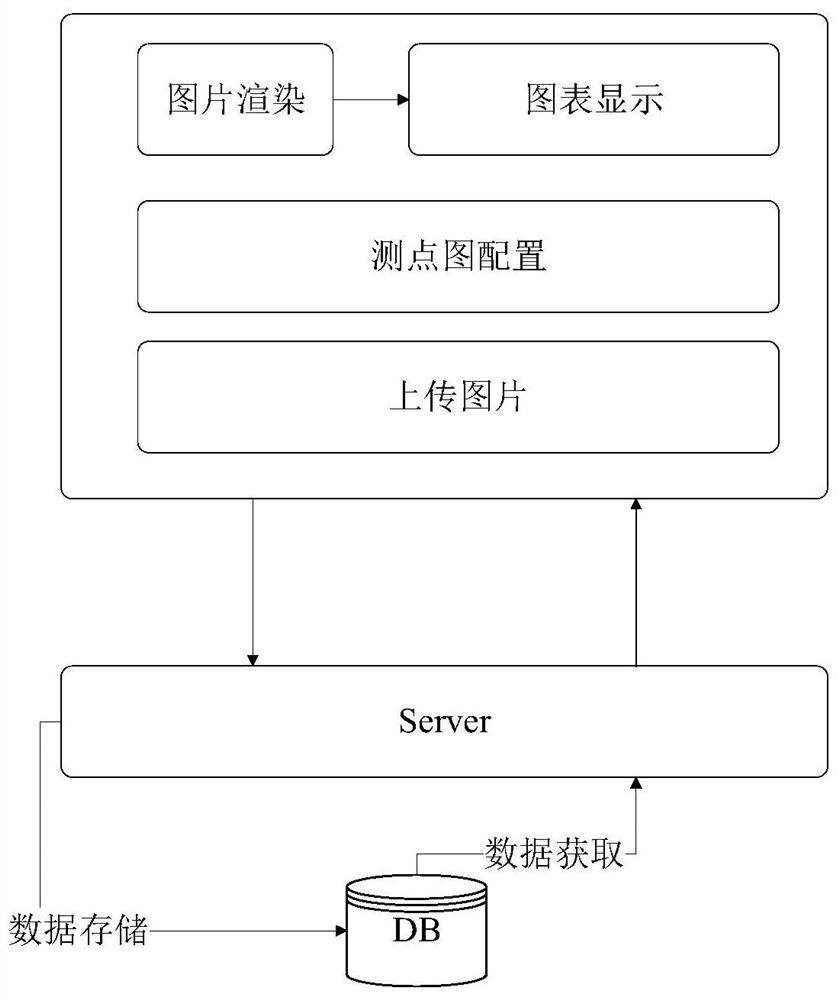
[0023] A label follow-up visual report generation system based on WebGL, including a server and a report configuration module, the server is used to store and query test result data and three-dimensional model data of the object to be tested;

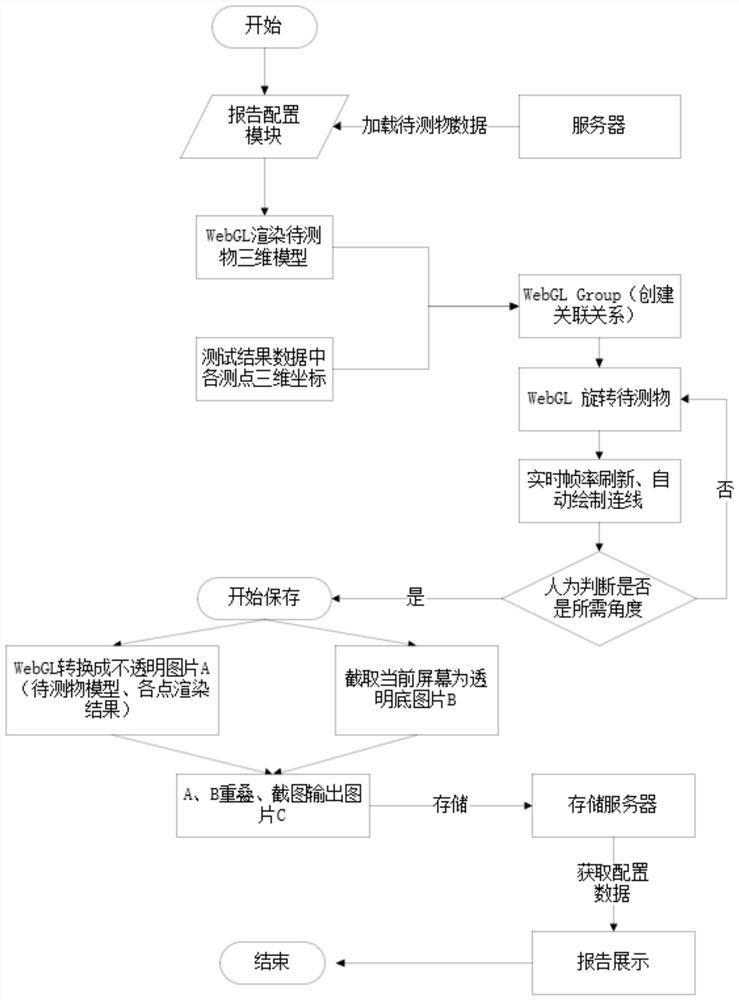
[0024] The report configuration module loads the 3D model data of the object under test from the server, and then uses the WebGL renderer to render; at the same time, the report configuration module retrieves the 3D coordinates of each measurement point in the test result data from the server and the corresponding test results of each measurement point, And establish an association relationship with specific points on the 3D model of the object to be measured. Specifically, you can first establish a WebGL Group strategy group, and then add both to the group; use WebGL to rotat...


PUM


Abstract

The invention discloses a label follow-up visualization report generation system and method based on WebGL, and the system comprises a server and a report configuration module, and the server is usedfor storing and querying test result data and three-dimensional model data of a to-be-tested object; the report configuration module loads three-dimensional model data of the to-be-tested object fromthe server, then performs rendering by using a WebGL renderer, calls three-dimensional coordinates of each measuring point and corresponding test results, and establishes an association relationship with specific points on the three-dimensional model; and the three-dimensional model of the to-be-tested object is rotated by using WebGL, and the frame rate is continuously refreshed: specifically, converting the space coordinate values of the measuring points in the three-dimensional model of the to-be-tested object into a screen coordinate system by using WebGL, recording the nearest intersection points of the measuring points and the corresponding labels, calculating the distance and the deviation angle between the two points, and drawing a straight line according to the distance and the deviation angle. The scheme is suitable for webpage end visual process report output, label follow-up is achieved by means of WebGL, manual punctuation is not needed, and the accuracy of the process report can be improved.

Description

technical field [0001] The invention relates to the field of automobile production process analysis and evaluation, in particular to a system and method for generating a label follow-up visualization report based on WebGL. Background technique [0002] At present, similar systems that use 3D models to display, configure, and generate visual process reports use a non-web-side approach, by using OpenGL or similar technologies to load 3D digital models in applications and configure visual process reports, such as figure 1 shown. Most of the visual process reports on the BS side can only support the configuration of reports using image models. The basic structure is as follows: figure 2 shown. [0003] Although the existing non-web-side visual process report uses OpenGl-based 3D technology, it requires users to install the client in advance, which is cumbersome to use; on the other hand, it is difficult for the client to do all the cross-system processing Compatible, usually...

Claims


Application Information

Patent Timeline
IPC IPC(8): G06F16/957G06T15/00G06T17/00
CPCG06F16/9577G06T17/00G06T15/005Y02P90/30
Inventor 庄洵商朋朋徐航高圩
Owner 易思维(杭州)科技有限公司
Features
  • R&D
  • Intellectual Property
  • Life Sciences
  • Materials
  • Tech Scout
  • Unparalleled Data Quality
  • Higher Quality Content
  • 60% Fewer Hallucinations
Learn More