
Processor exception debugging tracking method, device and system

A technology for tracking devices and processors, which is applied in response to error generation, hardware monitoring, etc., and can solve problems such as positioning and analysis of unfavorable problems

Pending Publication Date: 2021-04-20
上海擎昆信息科技有限公司
View PDF0 Cites 4 Cited by
  • Summary
  • Abstract
  • Description
  • Claims
  • Application Information

AI Technical Summary

Problems solved by technology

[0005] In addition, since the processor has entered an abnormal state when it executes to the wrong address, what the debugger sees is the state of the processor after the error occurs, and the state before the error often changes, which is not conducive to the positioning and analysis of the problem

Method used


Image

  • Processor exception debugging tracking method, device and system
  • Processor exception debugging tracking method, device and system
  • Processor exception debugging tracking method, device and system

Examples


Embodiment 1

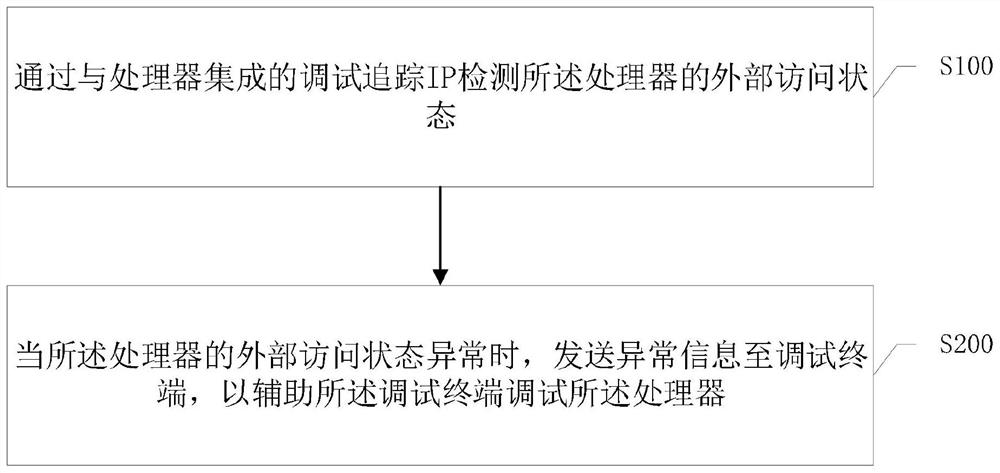
[0054] Such as figure 1 As shown, the present invention provides an embodiment of a method for debugging and tracking processor exceptions, comprising the following steps:

[0055] S100 Detecting the external access status of the processor through the debug tracking IP integrated with the processor.

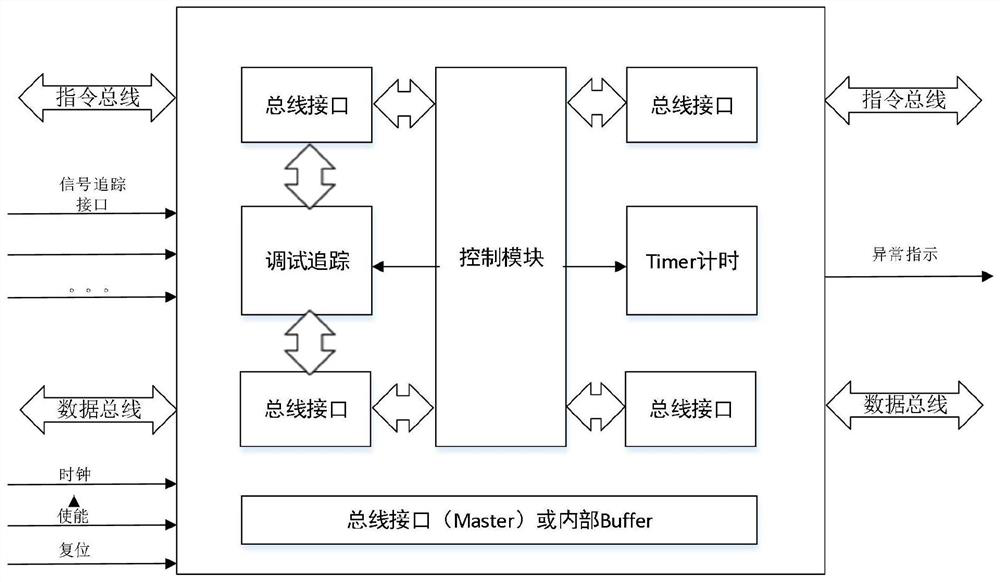
[0056] Specifically, the processor refers to a CPU running software that needs to be debugged, including but not limited to ARM. The debug trace IP refers to the debug trace IP integrated into the chip, and includes bus interface, internal timing, and enable control.

[0057] Exemplarily, the access of the processor to the external IP or Memory is detected by debugging and tracing the IP.

[0058]S200 When the external access state of the processor is abnormal, send an exception message to the debugging terminal, so as to assist the debugging terminal in debugging the processor.

[0059] It should be noted that the exception information includes exception prompt information to...

Embodiment 2

[0071] Based on the above-mentioned embodiment, the parts in this embodiment that are the same as those in the above-mentioned embodiment will not be described one by one. Based on the above-mentioned embodiment, in this embodiment, the debugging and tracking of the IP detected by integrating with the processor described in step S100 Describe the external access state of the processor, including steps:

[0072] By enabling the debugging and tracking IP, the detection module starts to track the processor's access to the outside, and analyzes the access return signal to confirm whether the access is normal or abnormal.

[0073] Specifically, the debug trace IP includes an internal timing module: when the debug mode is enabled, the cumulative count based on the input clock starts, and the width of the counter Timer can be configured with parameters.

[0074] Regarding step S200, when the external access state of the processor is abnormal, sending abnormal information to the debug...

Embodiment 3

[0085] After the said when the external access status of the processor is abnormal, sending the exception information to the debugging terminal to assist the debugging terminal to debug the processor, the step further includes:

[0086] After the debugging terminal obtains the exception information, check the access address in the exception information.

[0087] According to the access address in the exception information, check the software to confirm and correct the error to debug the processor.

[0088] Specifically, the debugging terminal may include an external debugging host, which includes a debugging information analysis tool that can run on the external debugging host.

[0089] Exemplarily, after the debugging terminal directly checks the external storage Buffer to obtain the exception information of the processor, it checks the software to confirm and correct the error so as to debug the processor.

[0090] In this embodiment, it is integrated into the chip together...


PUM


Abstract

The invention belongs to the field of chip debugging, and provides a processor exception debugging tracking method, device and system, and the method comprises the steps: detecting the external access state of a processor through a debugging tracking IP integrated with the processor; and when the external access state of the processor is abnormal, sending abnormal information to a debugging terminal to assist the debugging terminal to debug the processor. According to the method, the problem of chip debugging is fully considered in the chip design stage, the IP is integrated into the chip by detecting the debugging tracking IP of the processor for external access operation in real time, and in cooperation with simple driving software, debugging of the processor during abnormality can be greatly improved under the condition that only a small area is increased.

Description

technical field [0001] The invention relates to the field of chip debugging, in particular to a method, device and system for debugging and tracking abnormal processors. Background technique [0002] With the development of chip technology, more and more processors, IP, memory and other chip module units are integrated into a single chip through interconnection mechanisms such as buses. Significantly increased the difficulty and workload of chip hardware and software driver debugging. [0003] Existing processors usually have one or more exception modes. When the processor accesses a non-existent address or a wrong address, the processor will enter the exception mode. To find the error address, it is usually necessary to analyze the stack content when the exception is entered, and then reversely analyze the error address of the program. This method requires the debugger to be familiar with the architecture of the processor, which is difficult, and it is often difficult to a...

Claims


Application Information

Patent Timeline
IPC IPC(8): G06F11/07G06F11/34
Inventor 渠慎征王昕
Owner 上海擎昆信息科技有限公司
Learn More