
Front-end multi-data-source visual configuration method

A configuration method and multi-data source technology, applied in the field of data visualization, can solve the problems of unspecified data analysis, long working cycle, and inability to display multiple data sources, etc.

Pending Publication Date: 2021-05-14
上海数依数据科技有限公司
View PDF1 Cites 0 Cited by
  • Summary
  • Abstract
  • Description
  • Claims
  • Application Information

AI Technical Summary

Problems solved by technology

[0004] 1. A visual analysis interface requires front-end and back-end development work according to business requirements, with a long work cycle and heavy workload;
[0005] 2. For most configurable visual interfaces, the components and data sources are fixed, and the data analysis of multiple data sources cannot be displayed on one visual interface, nor can the data sources corresponding to the components be specified;
[0006] 3. The display area is fixed, and the display area cannot be increased or decreased dynamically

Method used


Image

  • Front-end multi-data-source visual configuration method

Examples


Embodiment Construction

[0027]The present invention is further illustrated in connection with the accompanying drawings, and it is to be understood that the term "first", "second" is used only for the purpose of describing purposes, and cannot be understood as instructions or implies relative importance or implicitly indicating the technical features indicated. Quantity. Thereby, the features of "first", "second" may be defined, and one or more of this feature may be further included. In the description of the utility model, the meaning of "multiple" is two or more, unless otherwise specifically defined.

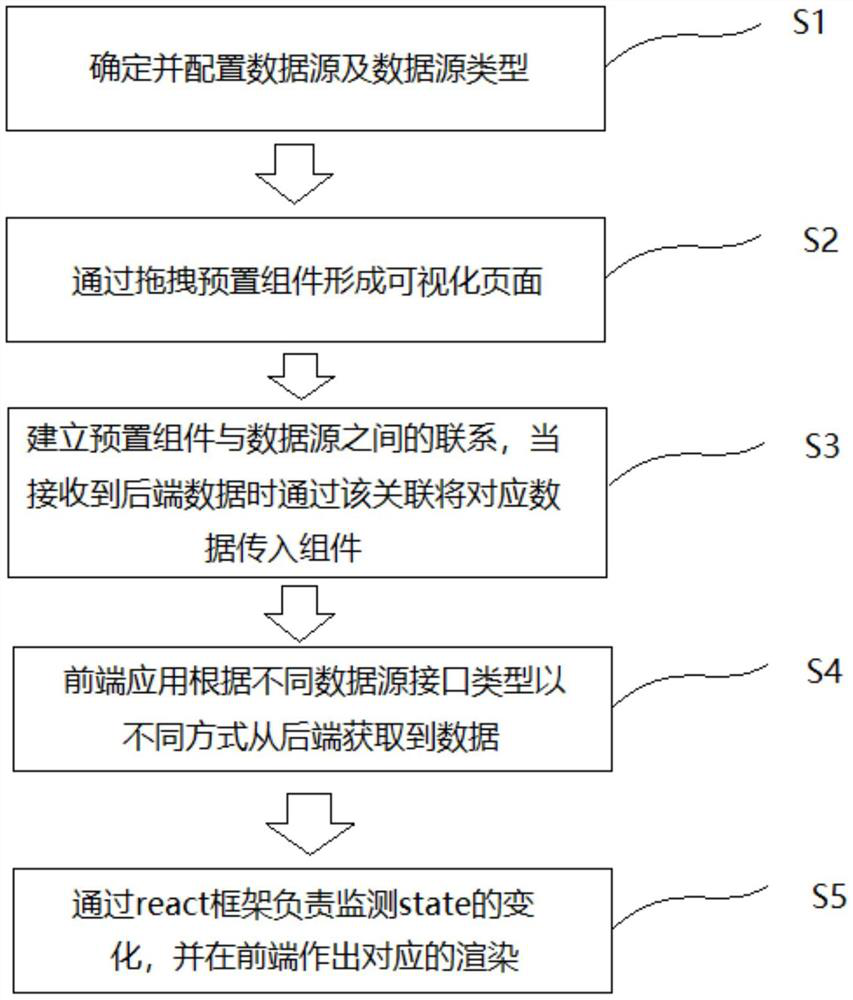
[0028]Such asfigure 1As shown, a front end multi-data source visualization configuration, the method includes:

[0029]S1: Determine and configure data source and data source type;

[0030]S2: Form a visual page by dragging the preset component;

[0031]S3: Estably the connection between the preset components and the data source will correspond to the corresponding data into the component by the association when rec...


PUM


Abstract

The invention discloses a front-end multi-data-source visual configuration method. The method comprises the steps of S1, determining and configuring data sources and data source types; S2, forming a visual page by dragging the preset component; S3, establishing a relation between the preset component and the data source, and transmitting corresponding data to the component through the relation when back-end data is received; S4, obtaining, by the front-end application, data from the rear end in different modes according to different data source interface types; and S5, monitoring change of the state through a react framework, and performing corresponding rendering at the front end. According to the front-end multi-data-source visual configuration, a user can describe the positions and data of various visual components in a declarative mode through documents and corresponding configuration pages, a visual analysis interface is rapidly configured, intervention of developers is not needed, and the development cycle and workload of visual application are greatly reduced.

Description

Technical field[0001]The present invention relates to the field of data visualization, in particular a front end multi-data source visual configuration.Background technique[0002]With the continuous development of computer technology and the Internet, companies collected a lot of business data in the basic information-based application, but these data require a lot of artificial summary and summary to get results, waste a lot of human and time. .[0003]China Patent CN201910853822.7 discloses a method of visualizing a JSON object. The specific steps include: S1, data source set up a connection method of the MONGODB database; S2, the data set selects the corresponding library table information, read the first Information; S3, conversion processing for the first JSON information, and handle all key index information, and determine the type of each index corresponding field; S4, according to the index information, batch processing, and stored in memory according to the page user In the da...

Claims


Application Information

Patent Timeline
IPC IPC(8): G06F8/38G06F16/26
CPCG06F8/38G06F16/26
Inventor 陈烨卿
Owner 上海数依数据科技有限公司
Learn More