Visual corridor analysis chart generation method and device and computer equipment
A technology for analyzing graphs and computers, applied in the field of graphics, can solve problems such as the inability to intuitively guarantee the height of surrounding buildings, the impact of urban planning and construction approvals, etc.
- Summary
- Abstract
- Description
- Claims
- Application Information
AI Technical Summary
Problems solved by technology
Method used
Image

Examples
Embodiment 1
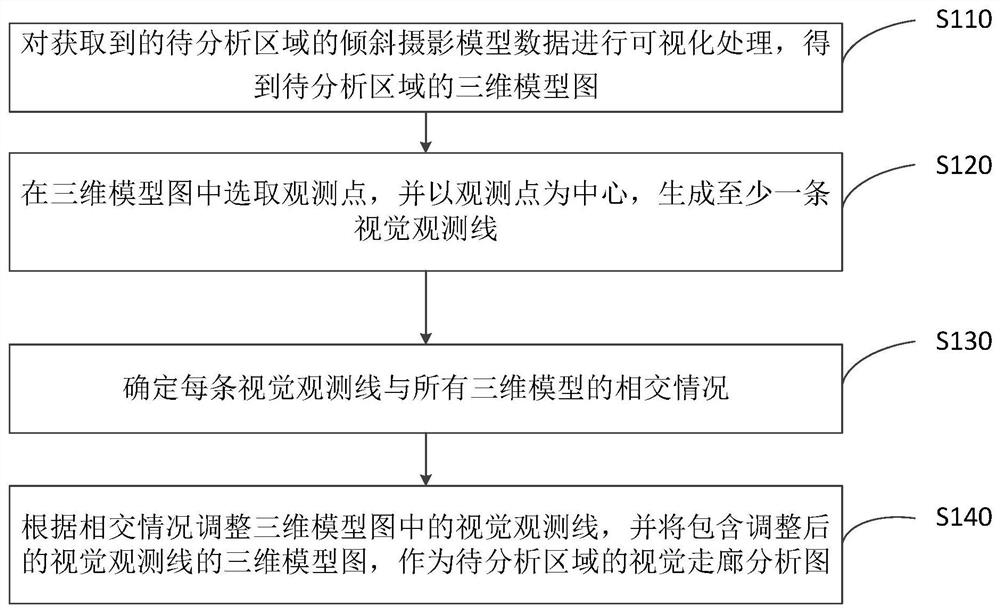
[0051] refer to figure 1 , figure 1 A schematic flowchart of a method for generating a visual corridor analysis diagram provided by an embodiment of the present invention, including:
[0052] S110. Visualize the acquired oblique photographic model data of the area to be analyzed to obtain a three-dimensional model diagram of the area to be analyzed, wherein the three-dimensional model diagram includes at least one three-dimensional model.
[0053] Specifically, oblique photography (Oblique photography) technology is a high-tech developed in the field of international surveying and mapping in recent years. By carrying multiple sensors on the same flight platform, five different Capture images from different perspectives, and then obtain rich high-resolution texture data of building top surfaces and side views.
[0054] Therefore, in an implementation mode that can be realized by the embodiment of the present invention, the unmanned aerial vehicle equipped with the calculated an...
Embodiment approach
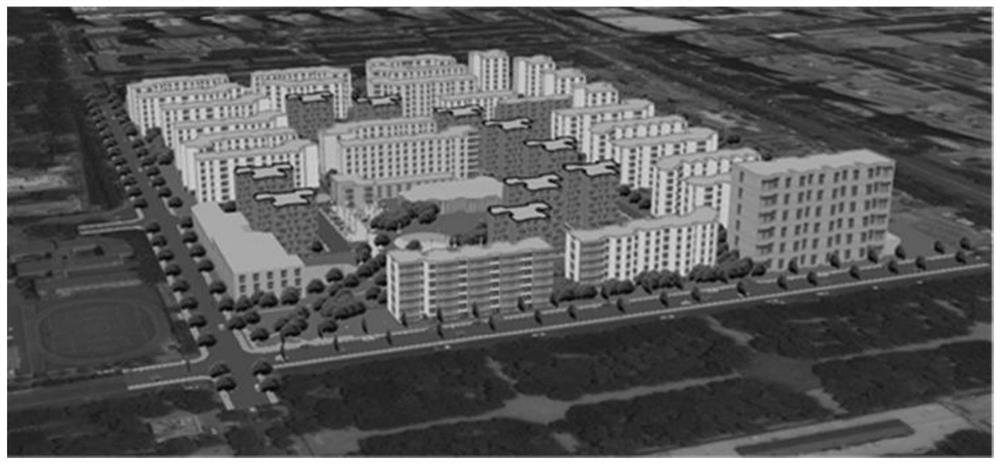
[0074] Exemplary, see Figure 4 , Figure 4 It shows a three-dimensional model diagram including adjusted visual observation lines provided by the embodiment of the present invention, including observation points and 8 adjusted visual observation lines. As shown in the figure, in this implementation mode, the embodiment of the present invention renders and displays the visual observation line that does not intersect with the 3D model and the ray segment before intersecting with the 3D model in the first rendering style, that is, as a solid line, The ray segment after intersecting with the 3D model is displayed in the second rendering style, that is, as a dotted line.
[0075] Therefore, adjusting the visual observation line according to the intersecting coordinates can effectively simulate the human line of sight, that is, determine the objects that can be observed by the naked eye, and then know the visual corridor status of the observation point in the area to be analyzed. ...
Embodiment 2
[0095] refer to Figure 5 , Figure 5 A schematic structural diagram of a device for generating a visual corridor analysis diagram provided by an embodiment of the present invention is shown, and the device 200 for generating a visual corridor analysis diagram includes:
[0096] A visualization module 210, configured to perform visualization processing on the acquired oblique photographic model data of the area to be analyzed, to obtain a three-dimensional model diagram of the area to be analyzed, wherein the three-dimensional model diagram contains at least one three-dimensional model;
[0097] A visual simulation module 220, configured to select an observation point in the three-dimensional model diagram, and generate at least one visual observation line centered on the observation point;
[0098] Intersection determination module 230, configured to determine the intersection of each visual observation line with all three-dimensional models;
[0099] The graph generation m...
PUM
 Abstract
Description
Claims
Application Information
 - R&D
- Intellectual Property
- Life Sciences
- Materials
- Tech Scout
- Unparalleled Data Quality
- Higher Quality Content
- 60% Fewer Hallucinations
Browse by: Latest US Patents, China's latest patents, Technical Efficacy Thesaurus, Application Domain, Technology Topic, Popular Technical Reports.
© 2025 PatSnap. All rights reserved.Legal|Privacy policy|Modern Slavery Act Transparency Statement|Sitemap|About US| Contact US: help@patsnap.com