
Big data visualization analysis method, device and equipment based on knowledge graph

A technology of knowledge graph and analysis method, applied in the field of big data visualization analysis method equipment and corresponding storage medium, big data visualization analysis device, and can solve the problems of complex development process and poor flexibility, etc.

Pending Publication Date: 2021-12-10
中科云谷科技有限公司 +1
View PDF0 Cites 2 Cited by
  • Summary
  • Abstract
  • Description
  • Claims
  • Application Information

AI Technical Summary

Problems solved by technology

[0005] The purpose of the present invention is to provide a big data visualization analysis method, device and system based on knowledge graph, which aims to solve the problems of poor flexibility and complicated development process caused by structured design in the generation of existing data reports

Method used


Image

  • Big data visualization analysis method, device and equipment based on knowledge graph
  • Big data visualization analysis method, device and equipment based on knowledge graph
  • Big data visualization analysis method, device and equipment based on knowledge graph

Examples


Embodiment Construction

[0037] Specific embodiments of the present invention will be described in detail below in conjunction with the accompanying drawings. It should be understood that the specific embodiments described here are only used to illustrate and explain the present invention, and are not intended to limit the present invention.

[0038] In the embodiments of the present invention, unless stated otherwise, the used orientation words such as "up, down, top, bottom" are usually for the directions shown in the drawings or for vertical, vertical or The term used to describe the mutual positional relationship of each component in terms of the direction of gravity.

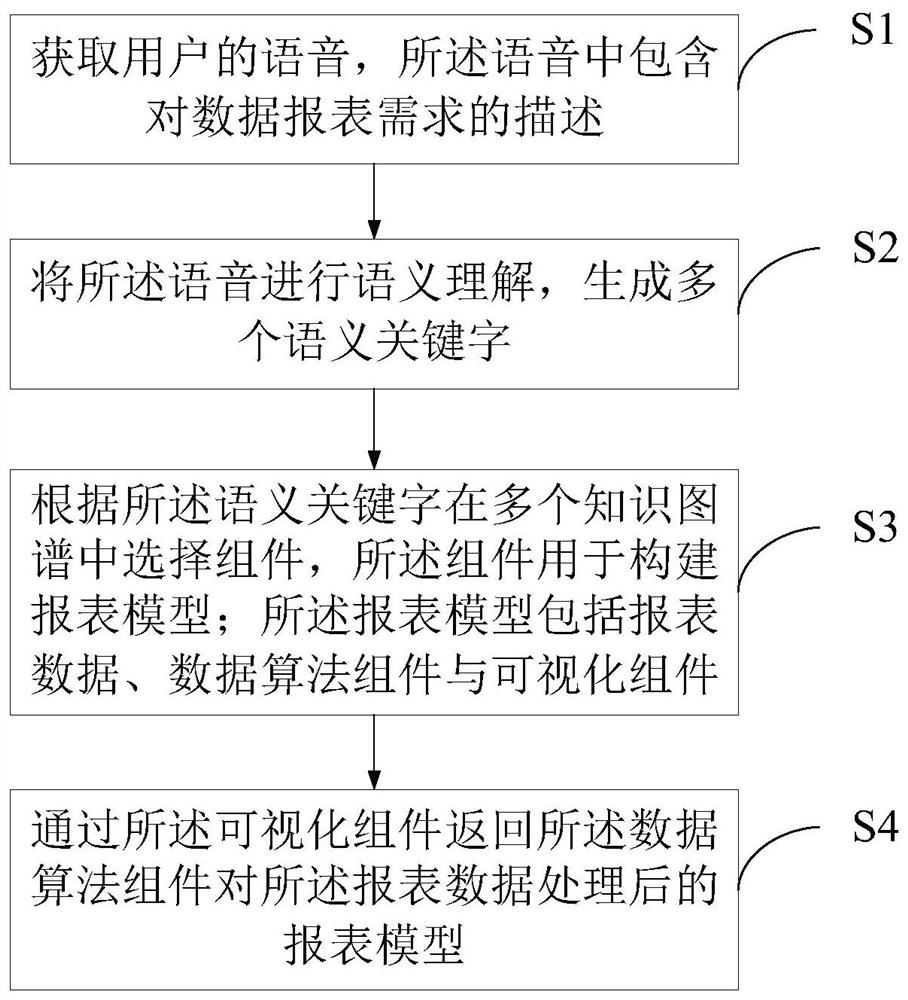
[0039] figure 1 It is a schematic flow diagram of a big data visualization analysis method based on a knowledge map in an embodiment of the present invention, such as figure 1 As shown, a big data visualization analysis method based on knowledge map, the method includes:

[0040] Acquire the user's voice, which contains a descri...


PUM


Abstract

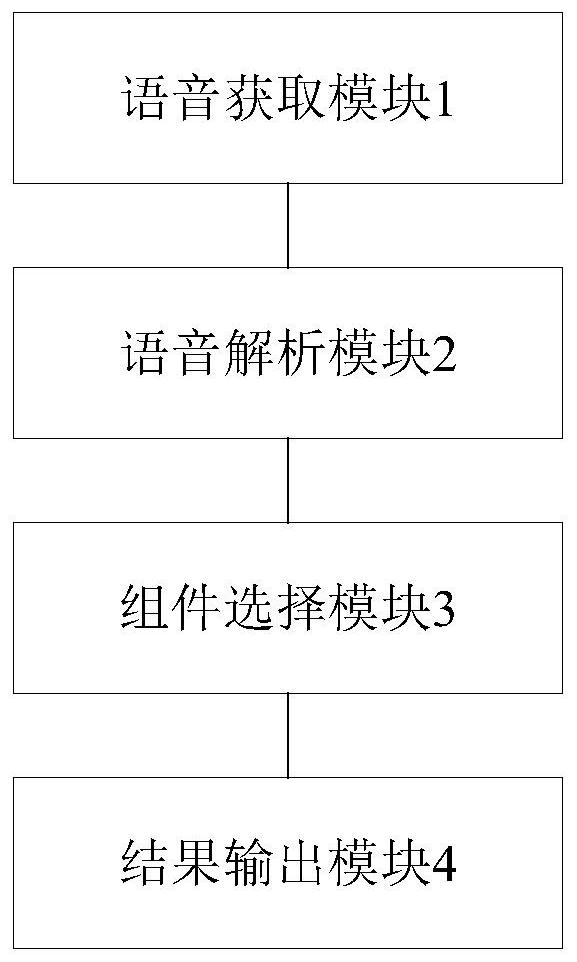
The embodiment of the invention provides a big data visualization analysis method based on a knowledge graph, and the analysis method comprises the steps: obtaining the voice of a user, wherein the voice comprises the description of a data report demand; performing semantic understanding on the voice to generate a plurality of semantic keywords; selecting components in a plurality of knowledge maps according to the semantic keywords, wherein the components are used for constructing a report model, and the report model comprises report data, a data algorithm component and a visualization component; and through the visualization component, returning the report model after the report data is processed by the data algorithm component. Meanwhile, the invention further provides a big data visual analysis device based on the knowledge graph and a big data visual analysis method and device based on the knowledge graph. According to the embodiment of the invention, the problems of poor flexibility and complex development process caused by structural design in existing data report generation can be solved.

Description

technical field [0001] The present invention relates to the field of data analysis, in particular to a big data visualization analysis method based on knowledge graph, a big data visualization analysis device based on knowledge graph, a big data visualization analysis method device based on knowledge graph and corresponding storage medium. Background technique [0002] The traditional data reporting business needs to go through multiple stages: demand research, business modeling, technical solutions, code development, testing, and delivery of results. When the user needs to adjust the scope, time period, style, etc. of the data report results, or needs to refine the relevant information (such as peak value, average value, and difference value) in the current report, it is often necessary to obtain the data from the parent data report business as a whole. Process, the process is lengthy, the cost is huge, and it lacks real-time performance. Existing schemes include two main...

Claims


Application Information

Patent Timeline
IPC IPC(8): G06F16/34G06F16/35G06F16/36G06F40/289G06F40/30
CPCG06F16/367G06F16/34G06F16/35G06F40/289G06F40/30
Inventor 陈丹妮黄跃峰
Owner 中科云谷科技有限公司
Learn More