Unbalanced data processing method for traffic accident analysis
A technology for data processing and traffic accidents, applied in electrical digital data processing, special data processing applications, reasoning methods, etc., can solve problems such as biased analysis results, and achieve the effect of reducing erroneous division
- Summary
- Abstract
- Description
- Claims
- Application Information
AI Technical Summary
Problems solved by technology
Method used
Image
Examples
Embodiment 1
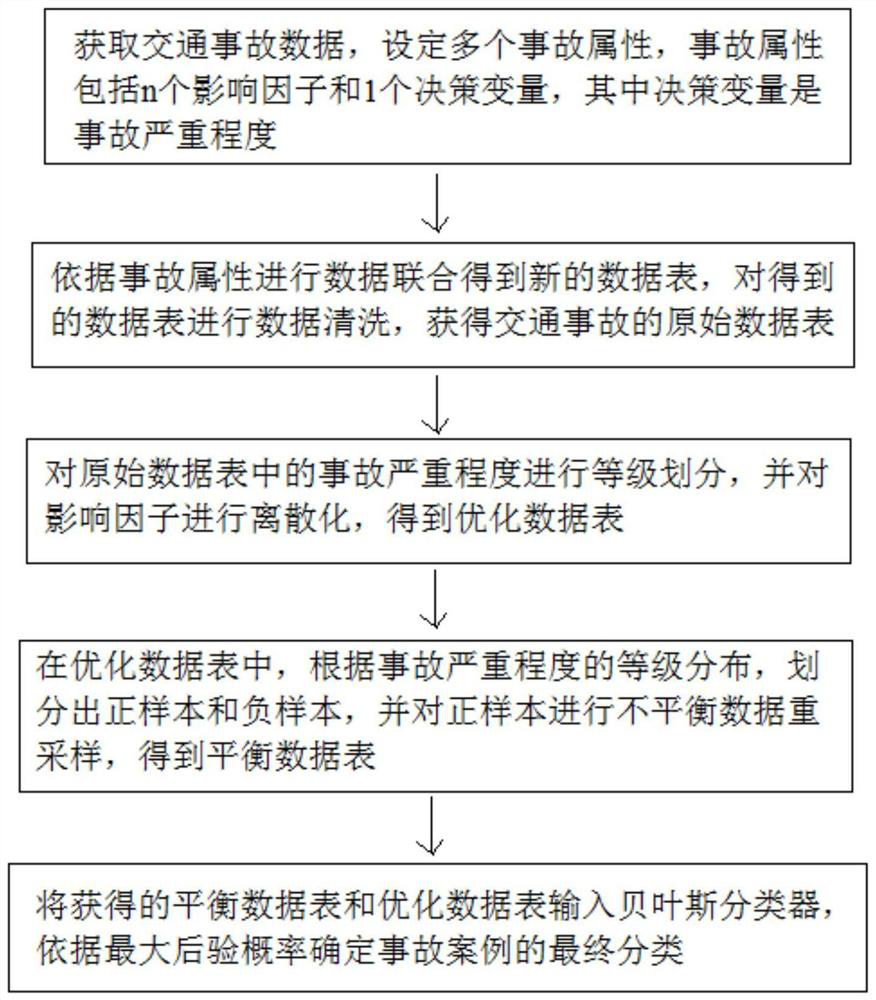
[0049] like figure 1 As shown, an unbalanced data processing method for traffic accident analysis includes the following steps:
[0050] S1: Obtain traffic accident data and set multiple accident attributes, which include n influencing factors and 1 decision variable, where the decision variable is the severity of the accident;
[0051] S2: Combine data according to the accident attributes to obtain a new data table, perform data cleaning on the obtained data table, and obtain the original data table of traffic accidents;
[0052] S3: Classify the severity of accidents in the original data table, and discretize the impact factors to obtain an optimized data table;
[0053] S4: In the optimization data table, according to the grade distribution of accident severity, divide the positive samples and negative samples, and re-sample the unbalanced data of the positive samples to obtain a balanced data table;
[0054] S5: Input the obtained balanced data table and optimized data t...
Embodiment 2
[0096] The data source used in this example is the traffic accident data in Guangdong Province from 2017 to 2018, with a total of 24,816 records. Each record includes relevant information at the time of the collision: basic information, vehicle information, party information, party information and road information.
[0097] S1: First set 15 accident attributes, including 14 influencing factors and 1 decision variable;
[0098] S2: Perform data union and data cleaning to generate an original data table with 15 columns, and the number of rows in the original data table is 24816; take the data of 16 cases in the original data table as an example, as shown in Table 1:
[0099] Table 1
[0100] BEL AIR OVE ROA CROs TYP INT WEA Tim VIS VIG CON DRV COL SEV 1 1 2 1 2 12 21 1 2012 / 2 / 3 15:50:00 3 1 1 1 21 loss and minor injury 1 3 2 1 1 12 21 1 2014 / 1 / 19 10:50:00 4 1 1 1 21 loss and minor injury 2 1 2 1 1 ...
Embodiment 3
[0114] This embodiment is similar to Embodiment 2, the difference is that this embodiment can analyze the grade distribution characteristics of accident severity, including descriptive statistics on decision variables and influencing factors, and complete the average value, standard deviation, maximum value, minimum value, and posterior distribution characteristics, where the calculation of posterior distribution characteristics includes statistical values of kurtosis and skewness and calculation of standard errors, and the descriptive statistics of each accident attribute are shown in Table 5;
[0115] Table 5 Descriptive statistics of accident attributes
[0116]
[0117] In this embodiment, the average value of the grade case frequency of the decision variable (accident severity) is 1.22, the standard deviation is 0.589, the maximum value is 3, and the minimum value is 1. Through the above descriptive statistics, the grade distribution characteristics of traffic accide...
PUM
 Abstract
Description
Claims
Application Information
 - R&D
- Intellectual Property
- Life Sciences
- Materials
- Tech Scout
- Unparalleled Data Quality
- Higher Quality Content
- 60% Fewer Hallucinations
Browse by: Latest US Patents, China's latest patents, Technical Efficacy Thesaurus, Application Domain, Technology Topic, Popular Technical Reports.
© 2025 PatSnap. All rights reserved.Legal|Privacy policy|Modern Slavery Act Transparency Statement|Sitemap|About US| Contact US: help@patsnap.com


