Supercharge Your Innovation With Domain-Expert AI Agents!

Linear full-real-time data dynamic visualization analysis method

A technology of real-time data and analysis methods, applied in data processing applications, image data processing, special data processing applications, etc., can solve problems such as the inability to display the changing trend of the pipeline network, the huge amount of data, and the loss of data visualization accuracy, etc., to achieve Improve the analysis and management capabilities of pipe network operation, improve the degree of consistency, and improve the effect of accuracy

Active Publication Date: 2022-05-13
广州泰禾大数据服务有限公司
View PDF12 Cites 0 Cited by
  • Summary
  • Abstract
  • Description
  • Claims
  • Application Information

AI Technical Summary

Problems solved by technology

[0004]However, managers cannot read and display the operating data of hundreds or even thousands of monitoring points in the pipeline network at the same time, nor can they display the status of the entire pipeline network at the same time. The change trend within the time period, in the face of complex situations such as different working condition parameters, different time periods, and different specific areas, it is even more difficult to accurately and intuitively display the operation form and dynamic change trend of the pipeline network
[0005] In the existing technology, the operation form and dynamic trend of the pipeline network are displayed, and the status of each position in the pipeline network is often calculated and simulated through the stability analysis of the pipeline network. For example, the current The analysis method disclosed in the technical literature "Newton's Pipeline Equation Method for Steady State Analysis of Gas Pipeline Network; Guan Yanwen, Wang Yonggang, Li Tongqiang, Li Fan; "Gas and Heat" is based on the node method mathematical model and uses the loop The calculation principle of Newton's pipe section equation method is proposed. Using the above calculation model, the internal state of the pipeline network can be analyzed and calculated, and the operation form and dynamic change trend of the pipeline network can be obtained. However, the data obtained through the calculation of the mathematical model in the above method The amount is huge, and it is impossible to visually display the dynamic model changes of the pipeline network; another example is the establishment of a gas pipeline based on GIS in the existing technical literature "Color-coded Urban Gas Pipeline Network SCADA System; Fang Rui; "Gas and Heat"" The plane model of the pipe network, and monitoring devices are installed at each key node. By defining different pressure levels as different color codes, the color code can replace the data display, and the pressure distribution of the pipe network can be expressed graphically. However, although this method realizes the visualization of the pipe network, However, this method essentially uses the data of each monitoring point in the pipeline network to draw iso-pressure line diagrams, and assigns different color codes to different iso-pressure line diagrams to distinguish different iso-pressure line diagrams, and is only used to display the distribution status inside the pipe network , this method does not deduce the mathematical linear relationship between the different data types, data range, precision, and other elements represented by the color scale, which will lead to the loss of the accuracy of data visualization

Method used


Image

  • Linear full-real-time data dynamic visualization analysis method
  • Linear full-real-time data dynamic visualization analysis method
  • Linear full-real-time data dynamic visualization analysis method

Examples


Embodiment

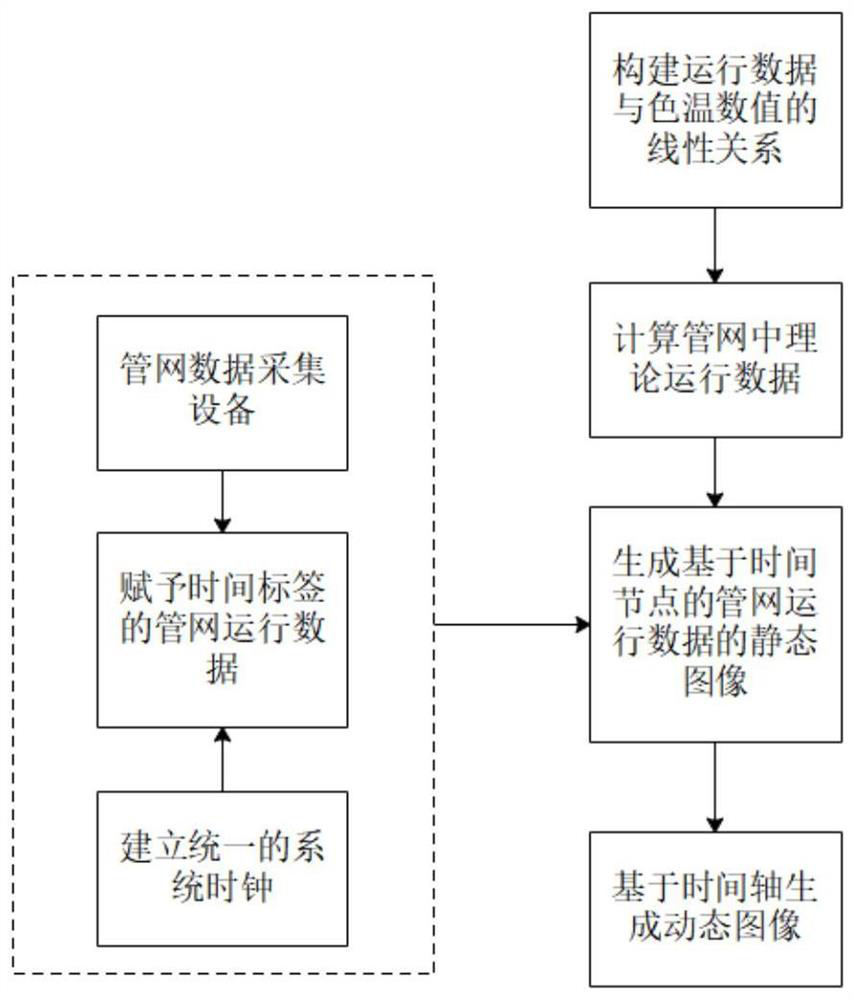
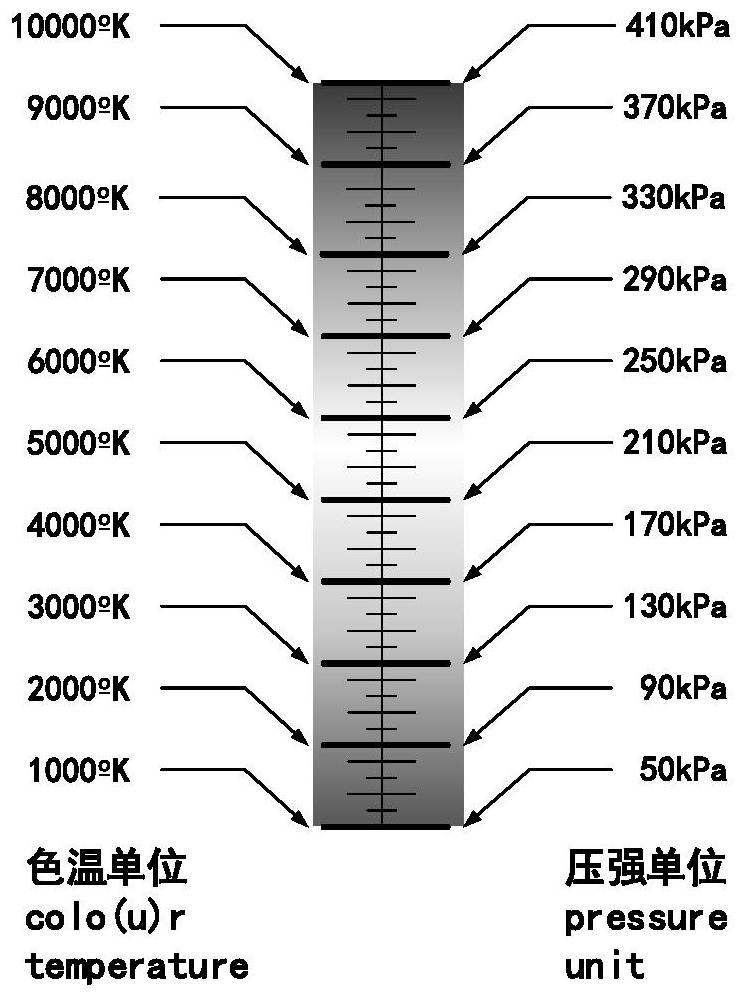
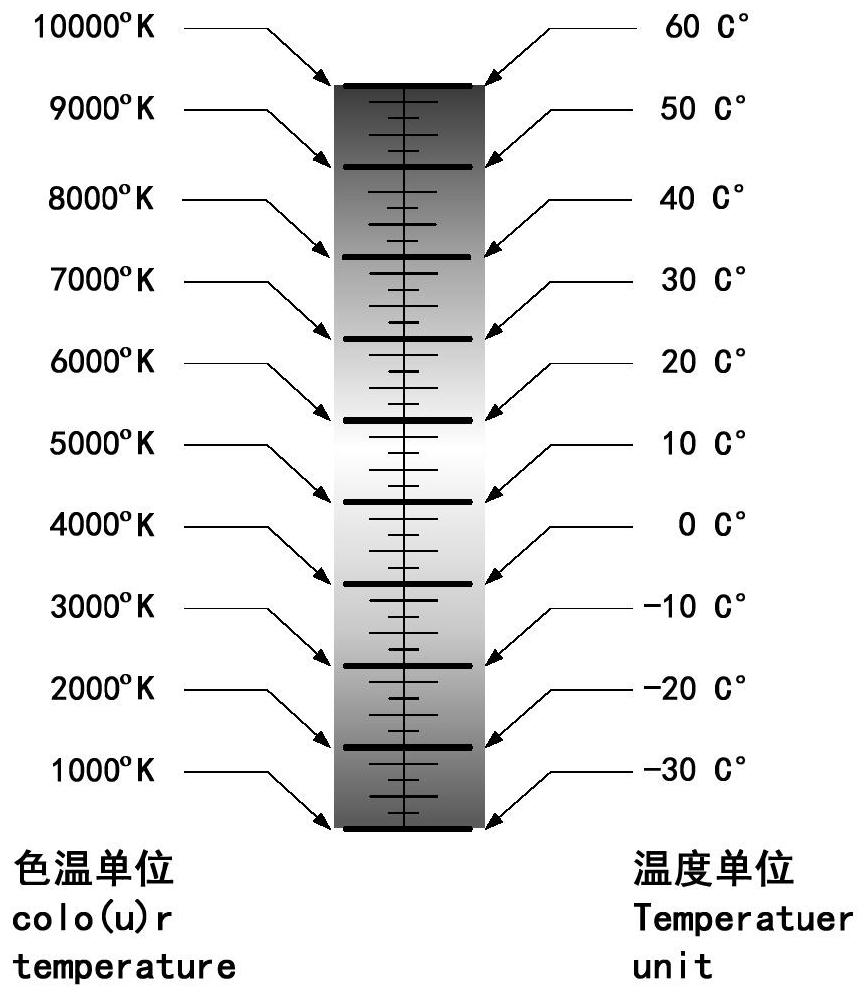
[0043] Such as figure 1 As shown, this embodiment discloses a linear full real-time data dynamic visualization analysis method, which constructs the linear mathematical relationship between the color of the Kelvin map at different color temperatures and the value of the pipeline network operation data, and uses intuitive color temperature and color to show the operation in the pipeline network The corresponding value of the data, with different color temperature colors to identify the corresponding pipe network parameter value range, and can obtain the distribution of different color temperature and color corresponding to the overall pipe network parameter value in minutes, seconds, hours, days and other time periods, and sort the pictures of the same period in order Play to form a dynamic real-time change trend of the pipe network, so as to fully display the process of the overall pipe network operation data changing over time, which includes the following steps:

[0044] S10...


PUM


Abstract

The invention relates to a linear full-real-time data dynamic visualization analysis method, which comprises the following steps of: constructing a linear mathematical relationship between different color temperatures and colors and pipe network operation data numerical values, displaying corresponding numerical values of operation data in a pipe network by adopting visual color temperatures and colors, and identifying corresponding pipe network parameter numerical value ranges by different color temperatures and colors; different color temperature and color distribution conditions corresponding to the whole pipe network parameter values can be obtained according to a time period, and pictures of the same period are played in the pipe network plane model according to a time sequence in combination with the pipe network plane model, so that a dynamic full-real-time change trend of the pipe network is formed; the process that the whole pipe network operation data changes along with time can be visually and comprehensively displayed, so that a user can know the whole operation state of the pipe network, and a judgment basis can be provided for pipe network optimization and operations such as pipe network scheduling, gas stealing exploration, leakage early warning and emergency rescue according to the change of the pipe network plane model; and the capability of analyzing and managing the operation of the pipe network by the user is greatly improved.

Description

technical field [0001] The invention belongs to the technical field of pipe network system operation analysis and relates to a dynamic visualization analysis method for linear full real-time data. Background technique [0002] At present, most of the pipeline networks have established SCADA systems. Install and temperature sensors at key nodes of the pipeline network to collect data on important parameters such as pressure, temperature, flow, and flow velocity of the pipeline network nodes, and transmit these pipeline network operating data through wired Or wirelessly, it is transmitted to the corresponding dispatching center to monitor and manage the operation status of the pipe network. [0003] Managers can read the operation data very intuitively for a single monitoring point in the pipeline network, and can display the data change trend of a monitoring point within a certain time period through various forms such as graphs and histograms. [0004] However, managers can...

Claims


Application Information

Patent Timeline
Patent Type & Authority Applications(China)
IPC IPC(8): G06F30/18G06Q10/06G06Q50/06G06T11/00G06T11/20
CPCG06F30/18G06T11/206G06T11/001G06Q10/06313G06Q50/06
Inventor 徐维粤施峰方伟东陈晓东谢统才
Owner 广州泰禾大数据服务有限公司
Features
  • R&D
  • Intellectual Property
  • Life Sciences
  • Materials
  • Tech Scout
  • Unparalleled Data Quality
  • Higher Quality Content
  • 60% Fewer Hallucinations
Learn More