Method and system for monitoring CO2 hour emission amount of emission source in target area through satellite

A target area and emission source technology, which is applied in the field of satellite monitoring CO2 hourly emissions of emission sources in the target area, can solve the problems of increasing manpower and material costs, large-scale monitoring, etc., and achieve reduced manpower and material costs, high operating speed, and The effect of accurate calculation results

Active Publication Date: 2022-08-02
BEIJING INSIGHTS VALUE TECHNOLOGY CO LTD
6 Cites 0 Cited by

AI-Extracted Technical Summary

Problems solved by technology

[0004]In the existing technology, the ground station can monitor the 24-hour CO2 concentration around the emission source, but it cannot carry out large-scale monitoring, nor can it That is to say, only...

Method used

Embodiments of the present invention do not need to set up ground stations around the CO2 emission source to measure the CO2 concentration situation, and only use satellite remote sensing and relational functions and Gaussian plume models to carry out large-scale monitoring of CO2 hours in the downwind direction of known emission point sources Emissions can provide an objective and reliable basis for a region, such as a county, city, country, region, or even the world to formulate unified emission standards, which greatly reduces the cost of manpower and material resources, and is green and low-carbon. In addition, in the embodiment of the present invention, the preset arc angle is set to 30 degrees, the preset diffusion radius value is set to 20KM, and the preset rectangle length and width are set to 200KM, which can achi...

Abstract

The invention relates to a method and a system for monitoring CO2 hourly emission of an emission source in a target area by a satellite. The method comprises the following steps: acquiring position information of the target emission source in the target area, XCO2 concentration information acquired by the satellite, and meteorological information corresponding to the XCO2 concentration information; selecting a preset area meeting a CO2 concentration condition according to the XCO2 concentration information, and constructing an observation window; constructing an XCO2 relation function according to the XCO2 concentration information in the observation window and the observation point distance information; according to the XCO2 relation function, the atmosphere total water vapor content, the near-ground pressure intensity and the ground wind speed, the CO2 hourly emission amount of the target emission source is obtained; the CO2 hourly emission in the downwind direction of a known emission point source is monitored in a large area through satellite remote sensing, and the manpower and material resource cost is greatly reduced.

Application Domain

Technology Topic

Satellite remote sensingAtmospheric sciences +5

Image

  • Method and system for monitoring CO2 hour emission amount of emission source in target area through satellite
  • Method and system for monitoring CO2 hour emission amount of emission source in target area through satellite
  • Method and system for monitoring CO2 hour emission amount of emission source in target area through satellite

Examples

  • Experimental program(3)

Example Embodiment

[0052] Example 1
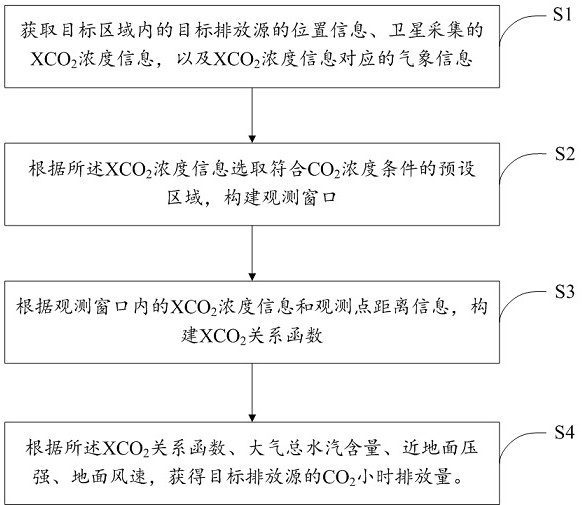
[0053] This embodiment provides a satellite monitoring target area emission source CO 2 Hourly emissions methods such as figure 1 shown, including:
[0054] S1: Obtain the location information of the target emission source in the target area and the XCO collected by the satellite 2 Concentration information, and XCO 2 Meteorological information corresponding to the concentration information.
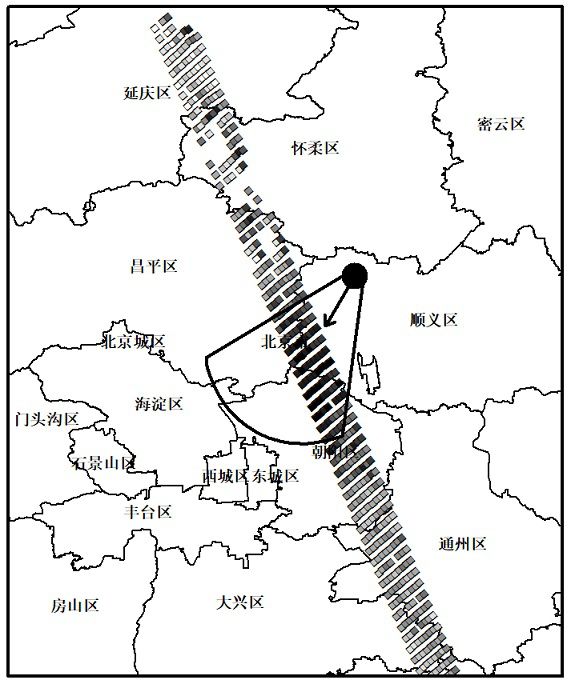
[0055] The satellite acquired XCO 2 The concentration information is characterized as the XCO obtained by the satellite at the time of satellite transit in the downwind direction of the emission source. 2 Distributing strip-shaped areas, the emission sources include target emission sources.
[0056] At the downwind position of the emission source, obtain the XCO near the emission source position through satellite 2 Concentration distribution, according to the size of the concentration value, use different colors to judge different concentration values, and draw the satellite observation orbit; the embodiment of the present invention is described by taking the OCO-2 satellite as an example, and the satellite observation orbit is specifically shown as follows figure 2 strips shown. The satellite observation orbit can visually show the concentration distribution.
[0057] Obtain the XCO of the downwind direction of the emission source and the moment of satellite transit 2 Distributing bar-shaped areas does not consider data at other times and wind directions, reducing the amount of computation to a certain extent and improving computational efficiency.
[0058] S2: According to the XCO 2 The concentration information is selected according to CO 2 Preset areas of concentration conditions to construct observation windows.
[0059] Before constructing the observation window, the method further includes: when the target area contains two or more emission sources, according to the diffusion area of ​​the emission sources and the XCO 2 According to the matching result, determine the target emission source and the corresponding high-value area; wherein, the diffusion area of ​​the emission source is based on the wind direction at the time of satellite transit, with the position of the emission source as the center and according to the preset arc angle , and a preset diffusion radius value to determine the fan-shaped area in the downwind direction of the emission source.
[0060] In this step, the diffusion region according to the emission source and the XCO 2 Concentration information to determine whether it matches; according to the matching result, determine the target emission source and the corresponding high-value area, including:
[0061] Judge the XCO 2 Whether there is at least partial overlap between the high concentration area of ​​the concentration information and the diffusion area of ​​the emission source; if it is determined that there is at least partial overlap, the emission source corresponding to the overlapping area is selected as the target emission source.
[0062] When there is only one emission source in the target area, then this emission source is the target emission source, because when the satellite passes through the area where the target emission source is located, multiple satellite observation orbits will appear, but the embodiment of the present invention only obtains all the emission sources. XCO at the time of satellite transit downwind of the target emission source 2 The satellite observation orbit drawn by the distribution bar area is centered on the high value area of ​​the observation orbit, and the observation window is determined by the preset rectangular length and width. The XCO 2 The high concentration area refers to the XCO in the satellite observation orbit 2 The part with higher concentration; in the embodiment of the present invention, the length and width of the preset rectangle are 200KM.
[0063] XCO collected by satellite when the target area contains two or more emission sources 2 Concentration information can be drawn to obtain multiple satellite observation orbits, select the XCO contained in the satellite observation orbit 2 For the emission source that overlaps with the emission source emission diffusion area in the high concentration area and the emission source diffusion area, the emission source corresponding to the overlapping area is used as the target emission source, and the observation window is made with the satellite observation orbit corresponding to the overlapping area. windows are matched, wherein the target emission source includes at least one emission source.
[0064] In the embodiment of the present invention, taking a target emission source in Shunyi District, Beijing as an example, the preset diffusion range value is set to 20KM. When the satellite passes through the area where the target emission source is located, the wind direction of the target emission source is Northeast, the angle is set to 30 degrees, by taking the target emission source as the center, the preset diffusion range value is the radius, and the fan-shaped area of ​​emission diffusion of the target emission source is determined according to the angle value along the wind direction. figure 2 shown.
[0065] Considering that there may be more than one emission source in the target area, if the target emission source is uncertain, the calculation result will be affected, so in order to make the calculation result more accurate, this step is used to determine the target emission source. According to the satellite transit time, the diffusion area of ​​the target emission source can be obtained, and the diffusion area and XCO can be established later. 2 Concentration information link; again because CO 2 Most of them diffuse in the downwind direction, so only the downwind diffusion area of ​​the target emission source is considered, which can simplify the calculation process and improve the calculation efficiency.
[0066] Filter to get with XCO 2 The observation window is then constructed to make the final result more accurate after the target emission source associated with the high concentration area.
[0067] S3: According to the XCO within the observation window 2 Concentration information and observation point distance information to construct XCO 2 relational function.
[0068] In this step, it specifically includes: taking the minimum latitude and longitude position in the observation window as the starting point, calculating the distance between the observation point in the observation window and the starting point, using the Gauss equation to calculate the XCO of the observation point 2 The concentration value is the abscissa, and the corresponding distance is the ordinate for fitting, and multiple fitting curves are obtained, and the relational expression corresponding to the curve with the largest correlation coefficient is selected as the XCO 2 relation function, where the CO in the air 2 Concentration and distance are expressed as a linear relationship.
[0069] Taking the minimum latitude and longitude position in the observation window as the starting point, calculate the distance between the observation point and the starting point on the satellite observation orbit strip in the observation window, and calculate the XCO of each point included in the satellite orbit in the observation window. 2 The relationship between the concentration and the corresponding distance is established. In the embodiment of the present invention, the distance and XCO of each point on the satellite observation orbit are calculated by the Gaussian equation. 2 concentration is fitted, such as image 3 As shown, multiple curves are obtained by fitting, and the curve corresponding to the maximum value of the correlation coefficient is selected as the final fitting curve. Among them, CO in the air 2 Concentration and Distance Embodiments of the present invention assume a linear relationship.
[0070] Put XCO 2 Correlation between concentration information and observation point distance information to calculate CO of target emission sources through Gaussian plume model 2 hourly emissions.
[0071] The XCO 2 The specific formula of the relation function is:
[0072]
[0073] Among them, XCO 2 for CO 2 Dry air specific column concentration (ppm), l is the distance along the orbit of the OCO-2 satellite in the moving window, a, b, A, µ and σ are the parameters that determine the shape of the curve, determined by the XCO 2Uncertainty statistic weighted inversely weighted nonlinear least squares fitting estimation, a x+b represents CO in the air 2 concentration, x is the distance from the observation point to the starting point, and e is a natural constant.
[0074] In the relation function, the CO in the air 2 Concentration changes are treated as linear changes, rather than simply selecting the maximum or average value as the CO in the air 2 The concentration value is more representative, and the combination of the Gaussian equation and the linear change has a better fitting effect, so that the calculated CO 2 Emissions are more accurate.
[0075] S4: According to the XCO 2 relationship function, total atmospheric water vapor content, near-surface pressure, and surface wind speed to obtain the CO of the target emission source 2 hourly emissions.
[0076] In this step, it specifically includes:
[0077] S40: Get the XCO 2 XCO in relational functions 2 Concentration maximum.
[0078] Solve the relationship function corresponding to the maximum value of the correlation coefficient to obtain the XCO 2 Concentration maximum.
[0079] S41: Put the XCO 2 The maximum concentration minus the corresponding CO in the air 2 concentration, obtain the CO of the target emission source at the corresponding observation point 2 emissions.
[0080] OK XCO 2 The distance corresponding to the maximum concentration, which is substituted into the CO in the air 2 Linear function of concentration and distance, solve to get CO in the air 2 concentration value, the XCO 2 The maximum concentration minus the corresponding CO in the air 2 concentration value, obtain the CO of the target emission source at this location 2 emissions. Remove CO from the air 2 After the concentration value, the OCO-2 satellite observes XCO in the target area 2 Scatter distribution and removal of CO in the air 2 The Gaussian model fitting curve after the concentration value is as follows Figure 4 shown.
[0081] S42: Calculate the CO of the target emission source at the corresponding observation point 2 A relationship is established between the emissions and the Gaussian plume model to obtain the emission rate of the target emission source.
[0082] Combined with the total water vapor content of the atmosphere, the pressure near the ground, and the wind speed at 10 meters above the ground, the formula of the Gaussian plume model is:
[0083]
[0084] Among them, F is the emission rate (g/s), z is the distance on the orbit, a is the atmospheric stability parameter, u is the wind speed (m/s), n is the distance in the vertical wind direction (m), g is the gravitational acceleration, M is the molecular weight, M air represents the molecular weight of air, M CO2 Indicates CO 2 molecular weight, P surf Atmospheric pressure near the surface (Pa), w is the total water vapor column content (kg/m 2 ), e is a natural constant.
[0085] Using this formula and the relational function, we can get the source CO 2 emission rate, and further calculate the CO 2 In addition, this formula takes into account many factors, making the calculation results more accurate.
[0086] In the embodiment of the present invention, the XCO of the formula of the Gaussian smoke model 2 CO for the target source at that location 2 Emission amount, after substituting it, the emission rate of the target emission source can be obtained.
[0087] S43: Calculate the CO of the target emission source through the emission rate 2 hourly emissions.
[0088] The above formula is used to calculate the CO2 emissions of a target emission source that the satellite transits Beijing Shunyi District. 2 emission rate F, then the CO of the target emission source 2 The hourly emission is F*3600s*10 -6 =1.22*10 3 t=1.22kt.
[0089] In addition, the CO of the target emission source within a preset time can also be obtained 2 Emissions, specifically: the CO2 of the target emission source that will be calculated 2 The discharge rate is multiplied by a preset time value.
[0090] The reason for choosing the maximum value is that it is easy to obtain and can simplify the calculation process, and the relationship with the Gaussian plume model is also relatively good, so that the CO2 of the target emission source can be calculated. 2 Hourly emissions are more precise.
[0091] The target area may be the county, city, country, organization, or global where the target emission source is located.
[0092] This embodiment of the present invention does not require CO 2 Set up ground stations around emission sources to measure CO 2 Concentration situation, only using satellite remote sensing, relational function and Gaussian plume model can carry out large-scale monitoring of CO in downwind direction of known emission point sources 2 Hourly emissions can provide an objective and reliable basis for a region, such as a county, city, country, region, or even the world to formulate unified emission standards, greatly reducing labor and material costs, green and low-carbon. In addition, in the embodiment of the present invention, the preset arc angle is set to 30 degrees, the preset diffusion radius value is set to 20KM, and the preset rectangle length and width are set to 200KM, which can achieve the effects of more accurate calculation results and more efficient running speed.

Example Embodiment

[0093] Example 2
[0094] This embodiment provides a satellite monitoring target area emission source CO 2 Hourly emissions systems such as Figure 5 shown, including:
[0095] The acquisition module 50 acquires the location information of the target emission source in the target area and the XCO collected by the satellite 2 Concentration information, and XCO 2 Meteorological information corresponding to the concentration information;
[0096] window building block 51, according to the XCO 2 The concentration information is selected according to CO 2 Preset area of ​​concentration condition, build observation window;
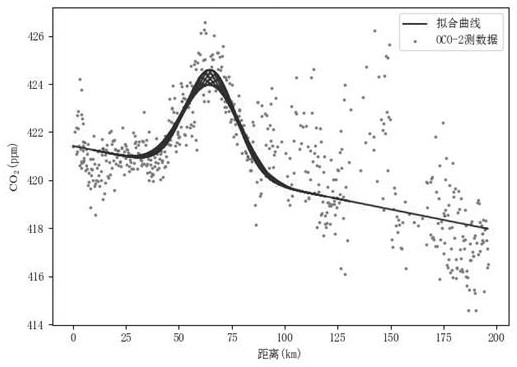
[0097] The function building module 52, according to the XCO in the observation window 2 Concentration information and observation point distance information to construct XCO 2 relational function;
[0098] Emissions determination module 53, based on the XCO 2 relationship function, total atmospheric water vapor content, near-surface pressure, and surface wind speed to obtain the CO of the target emission source 2 hourly emissions.
[0099] Optionally, before constructing the observation window, the window construction module 51 is further configured to: when the target area includes two or more emission sources, according to the diffusion area of ​​the emission source and the XCO 2 According to the matching result, determine the target emission source and the corresponding high-value area; wherein, the diffusion area of ​​the emission source is based on the wind direction at the time of satellite transit, with the position of the emission source as the center and according to the preset arc angle , and a preset diffusion radius value to determine the fan-shaped area in the downwind direction of the emission source.
[0100] Optionally, the XCO collected by the satellite of the acquisition module 50 2 The concentration information is characterized as the XCO obtained by the satellite at the time of satellite transit in the downwind direction of the emission source. 2 A strip area is distributed, wherein the emission source includes a target emission source.
[0101] Optionally, the window construction module 51 is used to judge the XCO 2 Whether there is at least partial overlap between the high concentration area of ​​the concentration information and the diffusion area of ​​the emission source; if it is determined that there is at least partial overlap, the emission source corresponding to the overlapping area is selected as the target emission source.
[0102] Optionally, the function establishment module 52 is configured to take the minimum latitude and longitude position in the observation window as the starting point, calculate the distance between the observation point and the starting point in the observation window, and use the Gauss equation to calculate the distance of the observation point. XCO 2 The concentration value is the abscissa, and the corresponding distance is the ordinate for fitting, and a plurality of fitting curves are obtained, and the relational expression corresponding to the curve with the largest correlation coefficient is selected as the XCO 2 relation function, where the CO in the air 2 Concentration and distance are expressed as a linear relationship.
[0103] Optionally, the emission determination module 53 is used for:
[0104] Get the XCO 2 XCO in relational functions 2 concentration maximum;
[0105] will the XCO 2 The maximum concentration minus the corresponding CO in the air 2 concentration, obtain the CO of the target emission source at the corresponding observation point 2 emissions;
[0106] The CO emissions of the target emission source at the corresponding observation point 2 Establish a relationship between the emission and the Gaussian plume model to obtain the emission rate of the target emission source;
[0107] Through the emission rate, the CO of the target emission source is calculated 2 hourly emissions.
[0108] Optionally, the XCO 2 The formula for the relation function is:
[0109]
[0110] Among them, XCO 2 for CO 2 Dry air specific column concentration (ppm), l is the distance along the orbit of the OCO-2 satellite in the moving window, a, b, A, µ and σ are the parameters that determine the shape of the curve, determined by the XCO 2 Uncertainty statistic weighted inversely weighted nonlinear least squares fitting estimation, a x+b represents CO in the air 2 concentration, x is the distance from the observation point to the starting point, and e is a natural constant.
[0111] Optionally, the formula of the Gaussian smoke flow model is:
[0112]
[0113] Among them, F is the emission rate (g/s), z is the distance on the orbit, a is the atmospheric stability parameter, u is the wind speed (m/s), n is the distance in the vertical wind direction (m), g is the gravitational acceleration, M is the molecular weight, M air represents the molecular weight of air, M CO2 Indicates CO 2 molecular weight, P surfAtmospheric pressure near the surface (Pa), w is the total water vapor column content (kg/m 2 ), e is a natural constant.

Example Embodiment

[0114] Example 3
[0115] The emission source CO is stored on the computer-readable storage medium provided by the present invention 2 Hourly emission monitoring program, the emission source CO 2 When the hourly emission monitoring program is executed by the processor, a satellite monitoring target area emission source CO provided by the present invention is realized 2 Steps of the Hourly Emissions Method.

PUM

no PUM

Description & Claims & Application Information

We can also present the details of the Description, Claims and Application information to help users get a comprehensive understanding of the technical details of the patent, such as background art, summary of invention, brief description of drawings, description of embodiments, and other original content. On the other hand, users can also determine the specific scope of protection of the technology through the list of claims; as well as understand the changes in the life cycle of the technology with the presentation of the patent timeline. Login to view more.

Similar technology patents

Feeding device for production of coiled material

InactiveCN103660077AReduce manpower and material costsReduce manufacturing costEngineeringRaw material
Owner:JIANGSU CANLON BUILDING MATERIALS

Testing method and testing device

InactiveCN110399298AQuick testReduce manpower and material costsSoftware testing/debuggingStart timeSimulated data
Owner:SUZHOU LANGCHAO INTELLIGENT TECH CO LTD

Fruit tree pest identification method and system based on convolutional neural network

PendingCN114758132AReduce wasteReduce manpower and material costsCharacter and pattern recognitionNeural architecturesCitrus volkamerianaFruit tree
Owner:CHONGQING UNIV OF POSTS & TELECOMM

Classification and recommendation of technical efficacy words

  • The calculation result is accurate
  • Reduce manpower and material costs

Analysis method of high-speed compressible supercavity flow characteristics

InactiveCN107784161AThe calculation result is accurateSolve practical application engineering problemsGeometric CADDesign optimisation/simulationSecondary developmentApplication engineering
Owner:BEIJING INSTITUTE OF TECHNOLOGYGY

Vehicle oil level sensor and implementation method thereof

ActiveCN102338655AEliminate interference from contact resistanceThe calculation result is accurateLevel indicators by floatsCalculated resultElectronic control unit
Owner:UNITED AUTOMOTIVE ELECTRONICS SYST

Driving power supply control circuit

InactiveCN102740572AReduce manpower and material costsIncrease productivityElectric light circuit arrangementPower flowControl circuit
Owner:SHANXI ZHAOXIN ELECTRIC POWER EQUIP

Medical device intelligent cloud management and maintenance system and method

InactiveCN102857381AReduce manpower and material costsMaintain accuracy and consistencyData switching networksAutomatic controlData transmission
Owner:CHENGDU RENZHI TECH

A multi-channel customized credit card intelligent application system

ActiveCN109377321AConvenient and efficient online card application experienceReduce manpower and material costsFinanceBuying/selling/leasing transactionsFingerprintData monitoring
Owner:上海浦东发展银行股份有限公司信用卡中心

Method for evaluating inductive effect of navigation product, testing device and construction method for testing device

ActiveCN104457790AReduce manpower and material costsReduce subjective influenceMeasurement devicesTest fixtureMaterial resources
Owner:BAIDU ONLINE NETWORK TECH (BEIJIBG) CO LTD
Why Eureka
Try Eureka