
Emotion and mood data input, display, and analysis device

a technology of mood data and display, applied in the field of mood data input, display and analysis devices, can solve the problems of excessive sensitivity, difficult to objectively check the mood of each member and how each member is feeling the mood of all the members, and difficult to lead the emotions of all the members to relaxation, etc., to eliminate excess sensitivity or insensitivity. , the effect of eliminating excess sensitivity

Active Publication Date: 2018-12-25
CELLREBIRTH
View PDF14 Cites 1 Cited by
  • Summary
  • Abstract
  • Description
  • Claims
  • Application Information

AI Technical Summary

Benefits of technology

The emotion / mood data input, display, and analysis device can objectively record the feelings of each member of a team or group and the mood of all members. It can also visually or audibly indicate the relative quantification of information and automatically determine if a member is excessively sensitive or insensitive. The device can provide a program to eliminate excess sensitivity or insensitivity. This technology can help improve communication and team unity.

Problems solved by technology

For this reason, some make excessively sensitive, too high reactions, and others make insensitive, too low reactions.
Even when the members of the group set a goal of relaxing the mood of the entire group and live collectively under the goal, it is difficult to objectively check the feeling of each member and how each member is feeling the mood of all the members.
Since it is not possible to adjust the different levels of sensitivity of the members to the averaged level, it is difficult to lead emotions of all the members to relaxation and to keep the mood of the entire group relaxed.
Further, as the number of members in the group is increased, or as the number of sections in the group is increased, it is extremely difficult to lead all the group members to relaxation and keep the members relaxed.
As seen above, the sensitivity or feeling of an individual greatly varies among individuals and is ambiguous, and it is difficult for surrounding members to objectively determine the sensitivity or feeling of one member by vision.
Since the sensitivity or feelings of members forming a group are difficult to manage, it is also difficult to keep the mood of the group in a desirable state.
Further, since there is no guideline about the sensitivity or the movement of a feeling, each individual has difficulty in adjusting the unevenness of his or her sensitivity by only making his or her own efforts.
However, as described above, the sensitivity or feeling of each member cannot be regulated or managed by rules or guidance, or compulsorily.
As a result, many members are suffering from the stress of continuously suppressing their unstable feelings and have mental or physical illnesses caused by the accumulation of such stress.
This impairs the activities of groups such as corporations and schools and raises the medical cost of the entire society, resulting in social problems.
With regard to a questionnaire-based survey method of Patent Literature 2, it is pointed out that it is not easy to obtain replies from all the questionnaire population and that respondents reply to the questionnaire by their own criteria and therefore produce inaccurate results.

Method used


Image

  • Emotion and mood data input, display, and analysis device
  • Emotion and mood data input, display, and analysis device
  • Emotion and mood data input, display, and analysis device

Examples


first embodiment

[1-1] Configuration of Emotion / Mood Data Input, Display, and Analysis Device

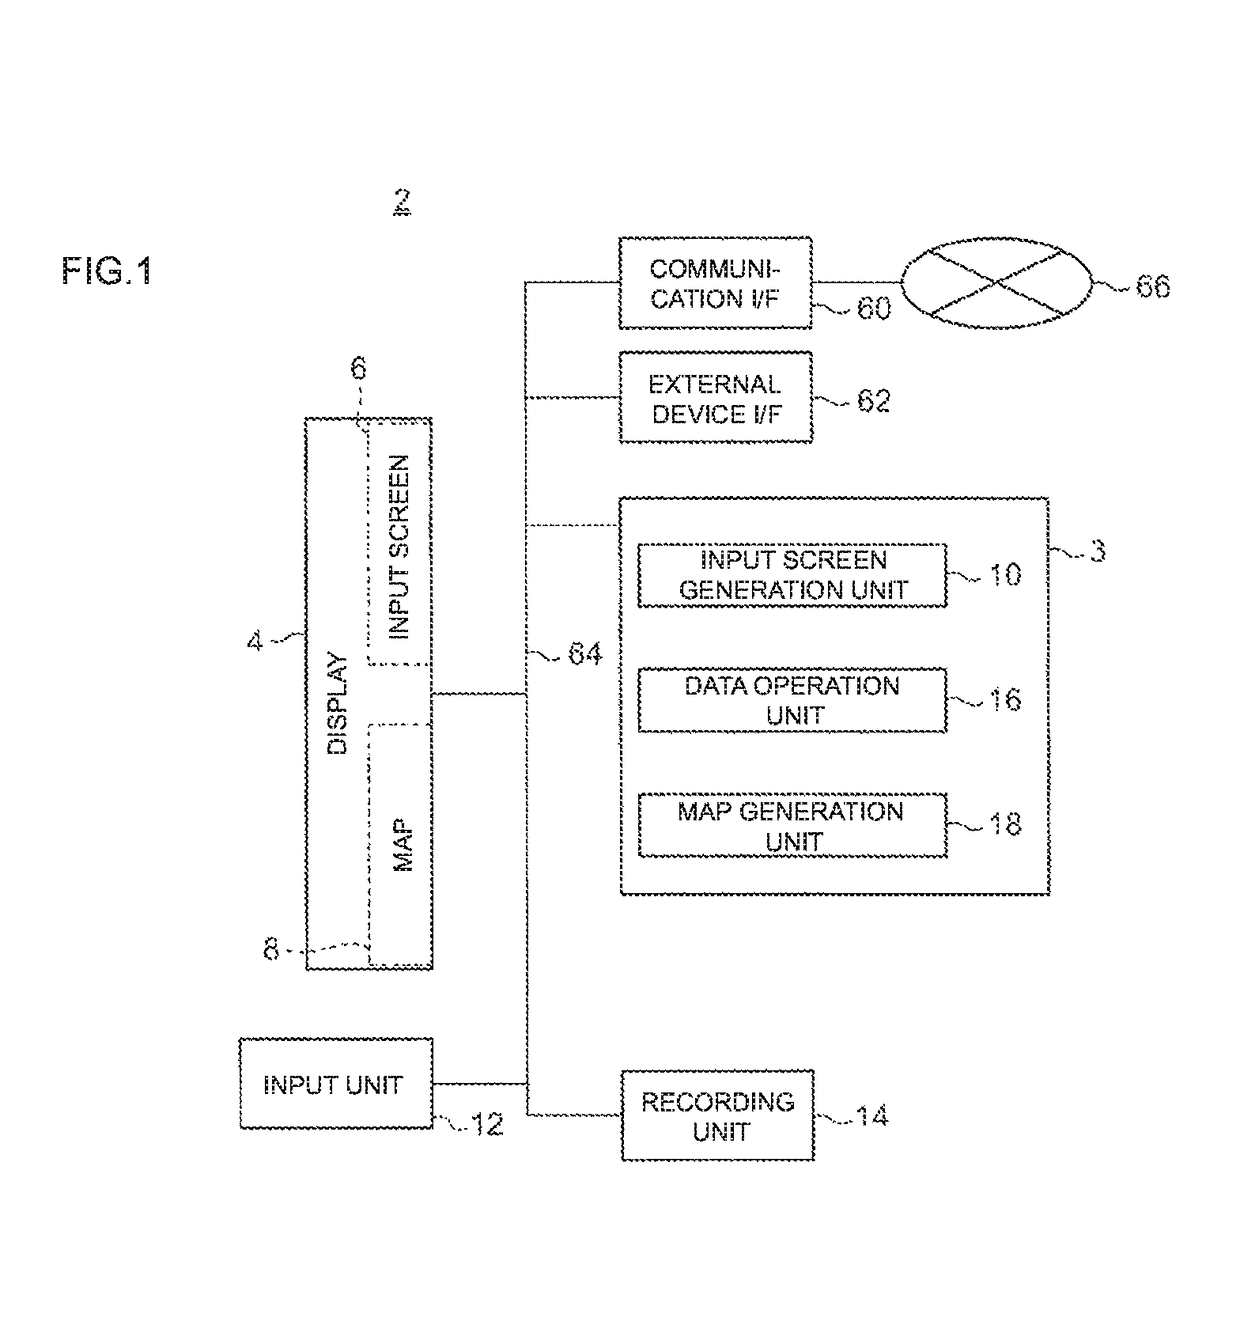
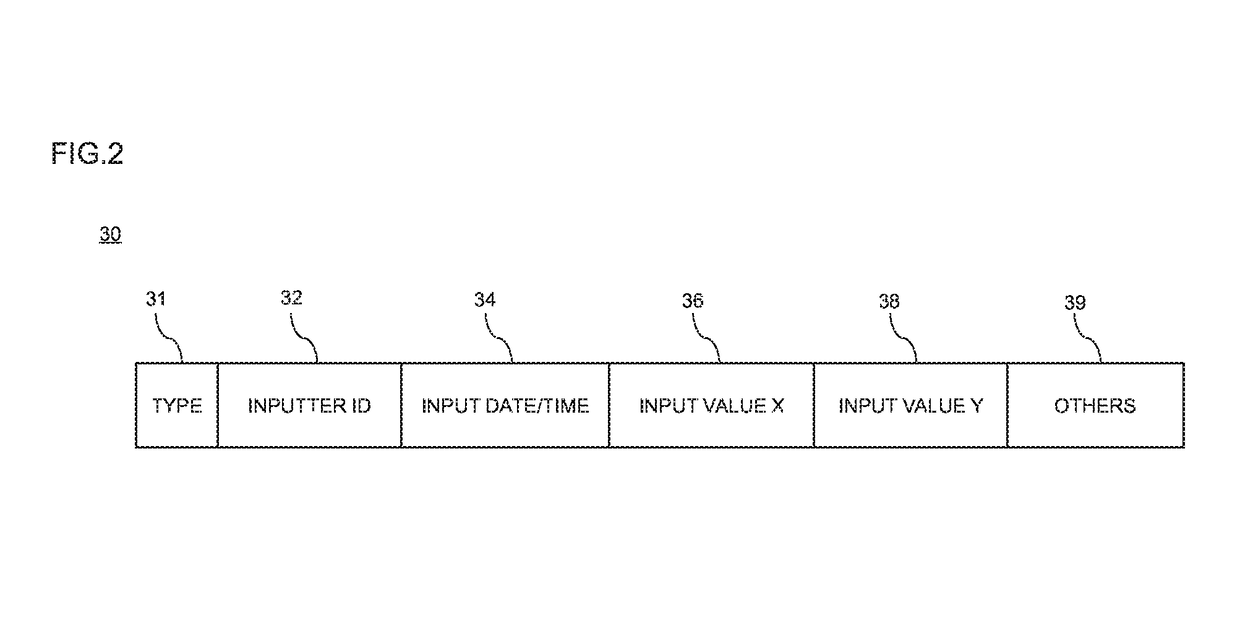
[0052]FIG. 1 is a block diagram of an emotion / mood data input, display, and analysis device of a first embodiment. An emotion / mood data input, display, and analysis device 2 shown in FIG. 1 includes a controller (processor) 3, a display 4, an input unit 12, a recording unit 14, a communication interface 60, and an external device interface 62. The controller (processor) 3 performs arithmetic operations and controls the entire device including the display 4, input unit 12, recording unit 14, communication interface 60, and external device interface 62. The display 4 displays operation results obtained by the controller (processor) 3 and the like and consists of a liquid crystal display, organic EL display, plasma display, or the like. The input unit 12 generates or receives data to be inputted to the device and typically consists of a keyboard, mouse, touchscreen, or the like. Note that an input screen 6 (to ...

second embodiment

[2-1] Configuration of Emotion / Mood Data Input, Display, and Analysis Device

[0115]FIG. 10 is a block diagram of an emotion / mood data input, display, and analysis device of a second embodiment. The emotion / mood data input, display, and analysis device of the second embodiment has approximately the same configuration as the emotion / mood data input, display, and analysis device of the first embodiment. For this reason, the same elements are given the same reference signs and will not be described, and the difference therebetween will be mainly described.

[0116]As with the emotion / mood data input, display, and analysis device of the second embodiment shown in FIG. 1, an emotion / mood data input, display, and analysis device 2 of the second embodiment shown in FIG. 10 includes a controller 3, a display 4, an input unit 12, a recording unit 14, a communication interface 60, and an external device interface 62. Further, it includes an optimum program presentation unit 22. The controller incl...


PUM


Abstract

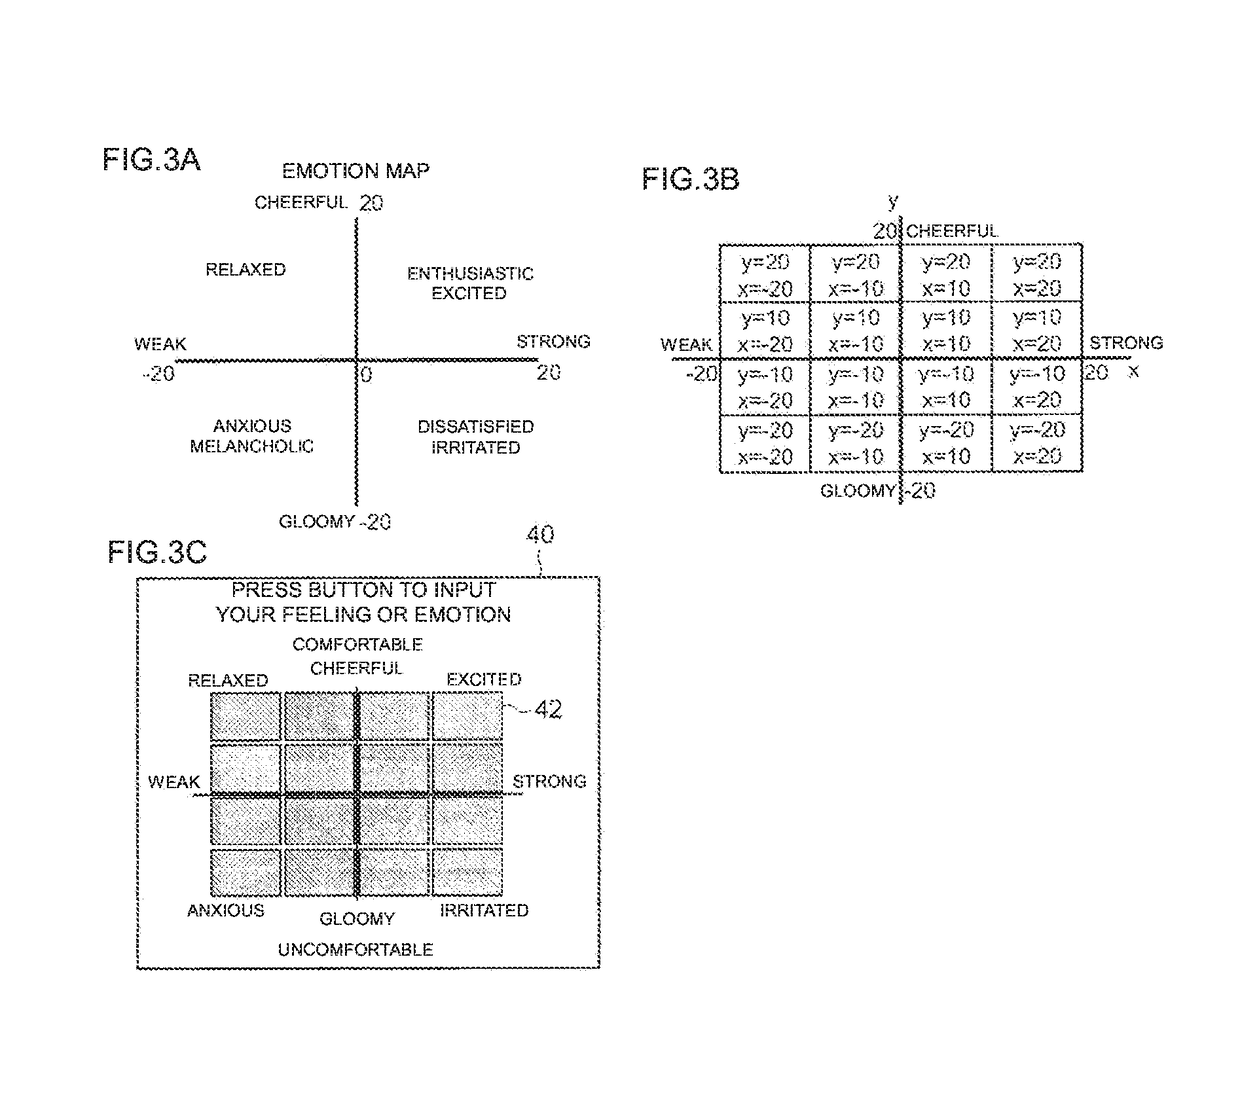
A feeling of each of members forming a group or team and the mood of all the members felt by each member are objectified and recorded. An emotion / mood data input, display, and analysis device includes a controller, a display, an input unit, and a recording unit. The controller includes an input screen generation unit. The input screen generation unit generates a first input screen that allows each of multiple members forming a group to, as an inputter, input whether an emotion or feeling of the each member is cheerful or gloomy, a level of cheerfulness or gloominess, whether the emotion or feeling is strong or weak, and a level of strength or weakness in a bifurcated manner. The display displays the first input screen. The controller captures data through the first input screen displayed on the display and the input unit and records the data in the recording unit.

Description

TECHNICAL FIELD[0001]The present invention relates to an emotion / mood data input, display, and analysis device.BACKGROUND ART[0002]In society, many individuals live collectively in a group or team consisting of multiple members, as seen in a home or office. The total of words or deeds expressed on the basis of feelings or emotions of the members of the group forms the mood of the group. The mood is inputted to the brain of each member through his or her sensitivity and then outputted from his or her brain in the form of a feeling or emotion. That is, an emotion (feeling) of each member and the mood (sensitivity) of the surrounding members felt by him or her have an influence on each other.[0003]Each member has his or her own feeling and his or her own sensitivity to the mood of the surrounding members, and the level of the sensitivity varies among members. For this reason, some make excessively sensitive, too high reactions, and others make insensitive, too low reactions. Even when ...

Claims


Application Information

Patent Timeline
Patent Type & Authority Patents(United States)
IPC IPC(8): G09B19/00G06Q50/10G06F3/0482G06T11/20G09B5/06
CPCG09B19/00G06F3/0482G06T11/206G09B5/06G06Q50/10G06T2200/24G06Q50/22
Inventor UNO, HIROYUKI
Owner CELLREBIRTH
Learn More