
Prediction of amount of crop or product remaining for field

a technology of crop or product and field, applied in the field of agriculture technology, can solve the problems of increasing the complexity of harvest operations, not being able to communicate or even determine information, and increasing problems, so as to improve logistics operations, reduce vehicle traffic, and improve management decisions.

Active Publication Date: 2019-02-12
LEADER TECH
View PDF2 Cites 23 Cited by
  • Summary
  • Abstract
  • Description
  • Claims
  • Application Information

AI Technical Summary

Benefits of technology

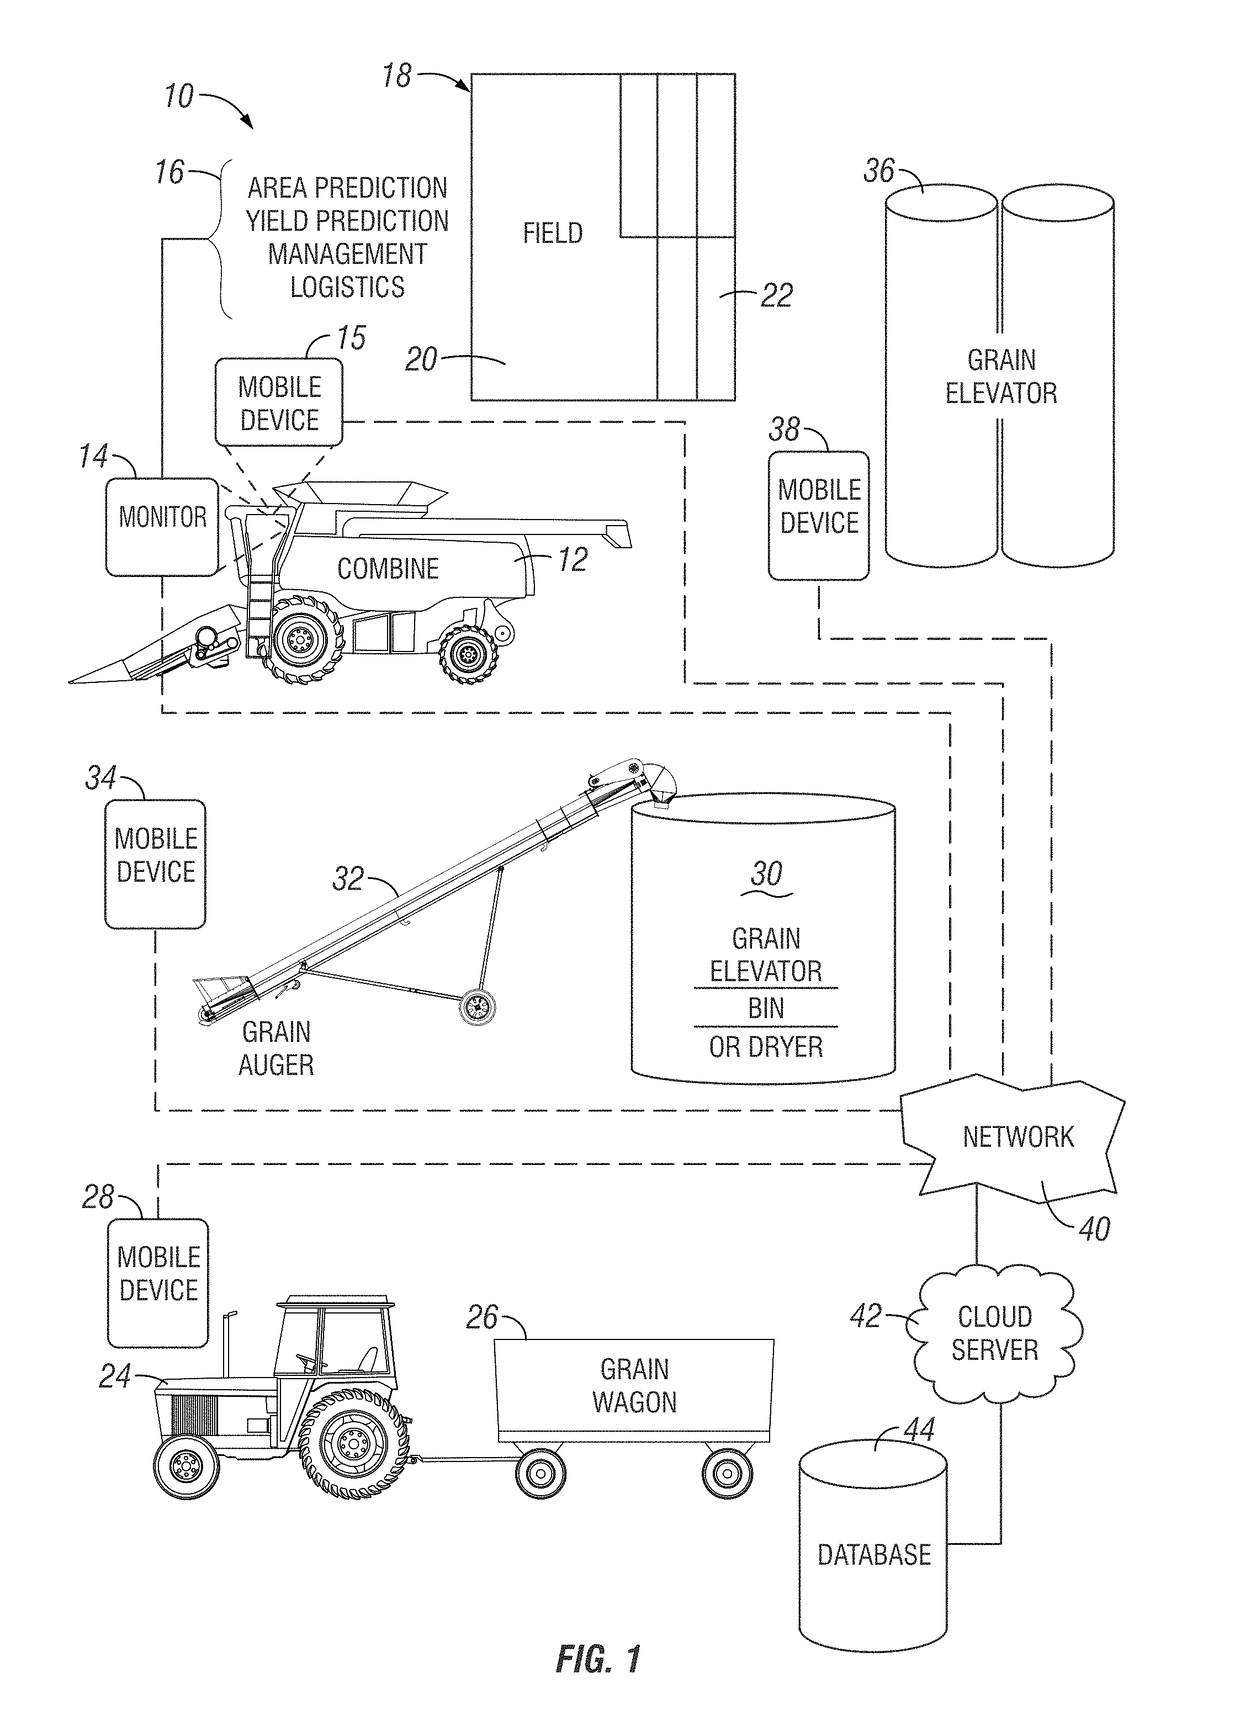
The present invention aims to improve the state of the art by determining how much grain or product remains in a field, providing better management decisions, improving logistics operations, reducing vehicle traffic within a field to avoid ground compaction, and performing agricultural operations in an orderly and efficient manner without rushing and avoiding safety issues associated with rushing. The invention provides information that can lead to better decision-making and helps perform agricultural operations in a more organized and safe manner.

Problems solved by technology

It is not particularly easy to communicate this information or even determine it in the first place.
The problems are increased when the complexities of harvest operations increase such as by number of combines, grain wagons, grain trucks, etc.
With respect to the problem of determining an estimate regarding the amount of grain remaining, there tends to be errors for a variety of reasons.
Aside from errors arising in the estimation of the amount of grain left in the field, there may be errors in the estimating how much grain is in the combine grain tank and in the auger wagon.
Moreover, the operator needs to focus their attention on combining the field, so attempting to make even rough estimates is problematic.
Of course, when there are multiple combines and auger wagons within the same field the complexities increase.
Further, there can be added complexities when a determination is being made regarding how much grain is left in a given portion a field as opposed to the entire field.
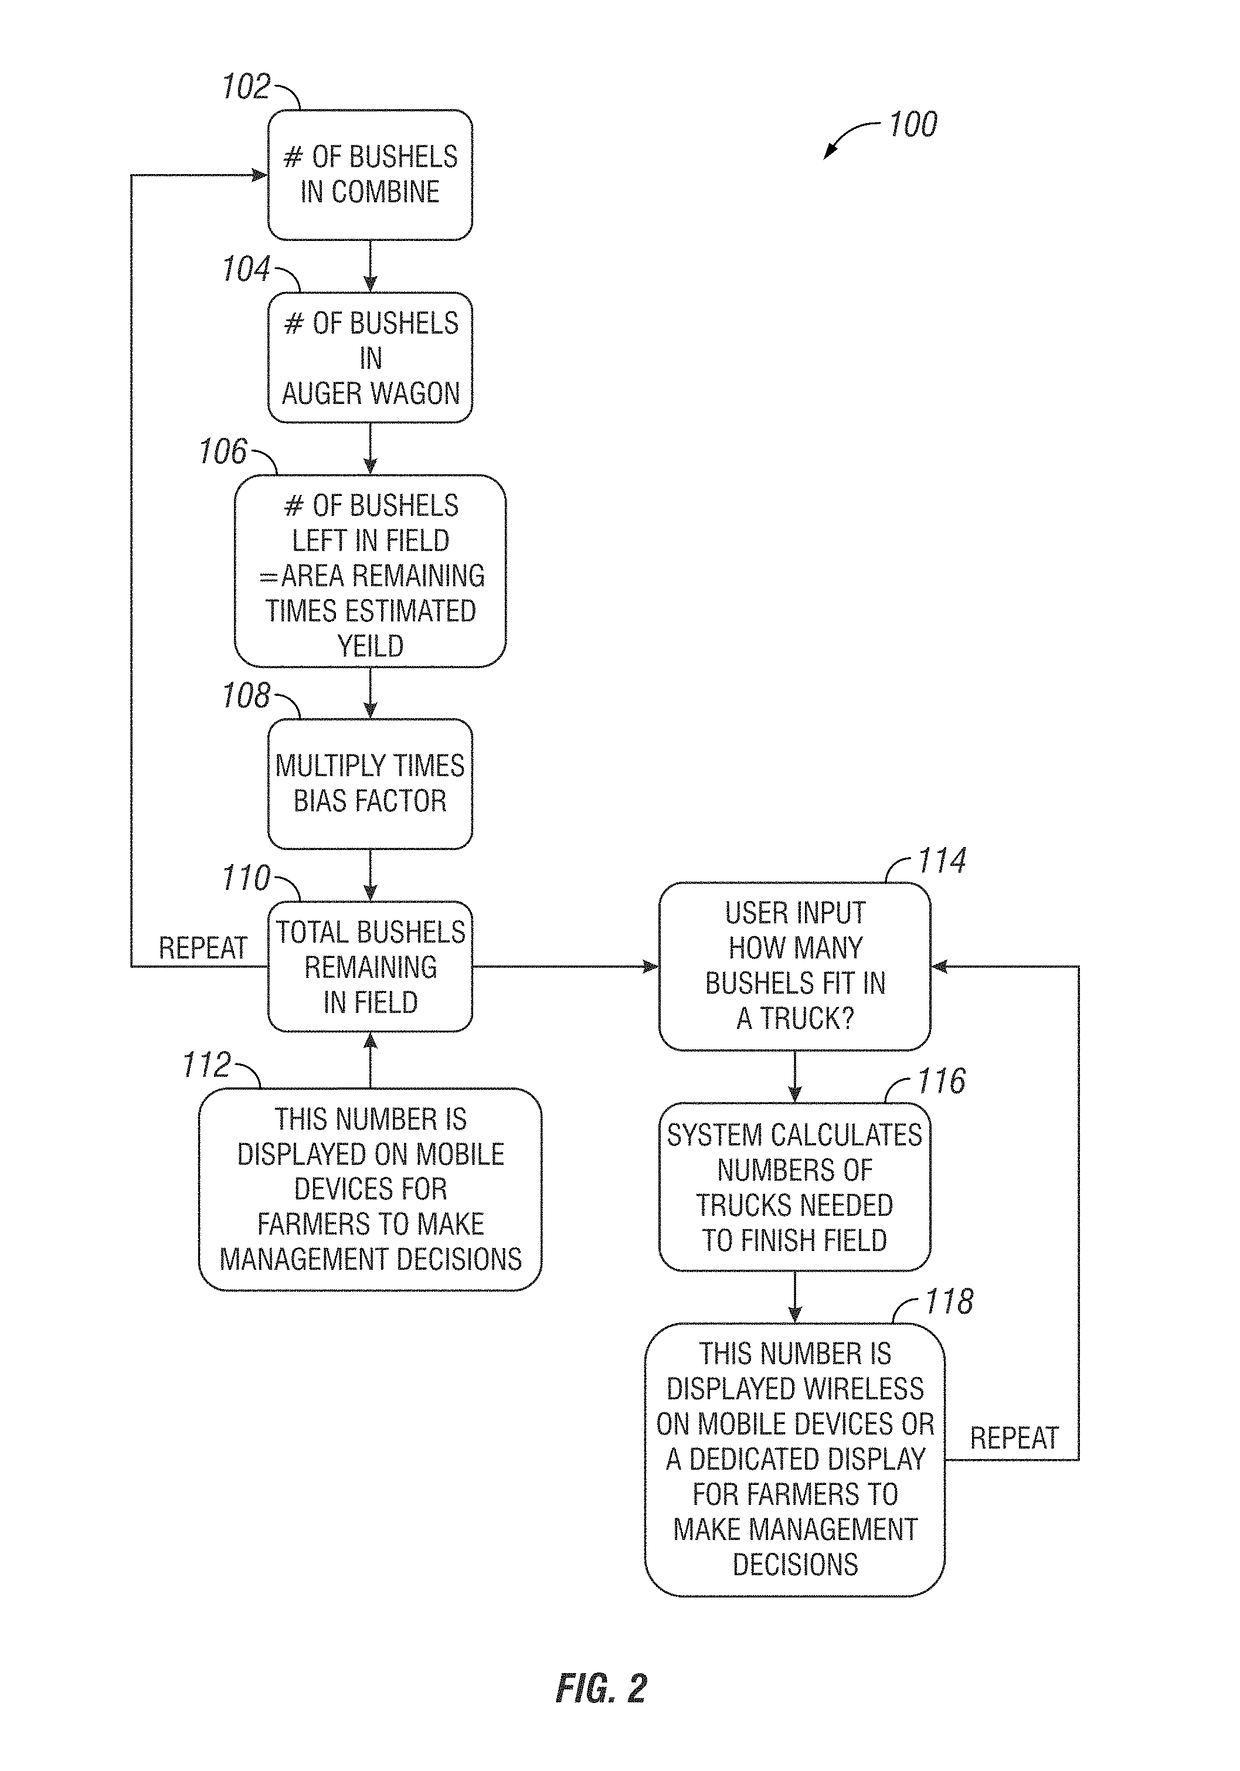
If an accurate estimate was available, this may prevent trucks from driving to the field which ultimately are not needed or not having enough trucks to convey grain, or making incorrect decisions regarding whether the additional grain left will fill a grain bin or dryer.

Method used


Image

  • Prediction of amount of crop or product remaining for field
  • Prediction of amount of crop or product remaining for field
  • Prediction of amount of crop or product remaining for field

Examples


example 1

D. Example 1

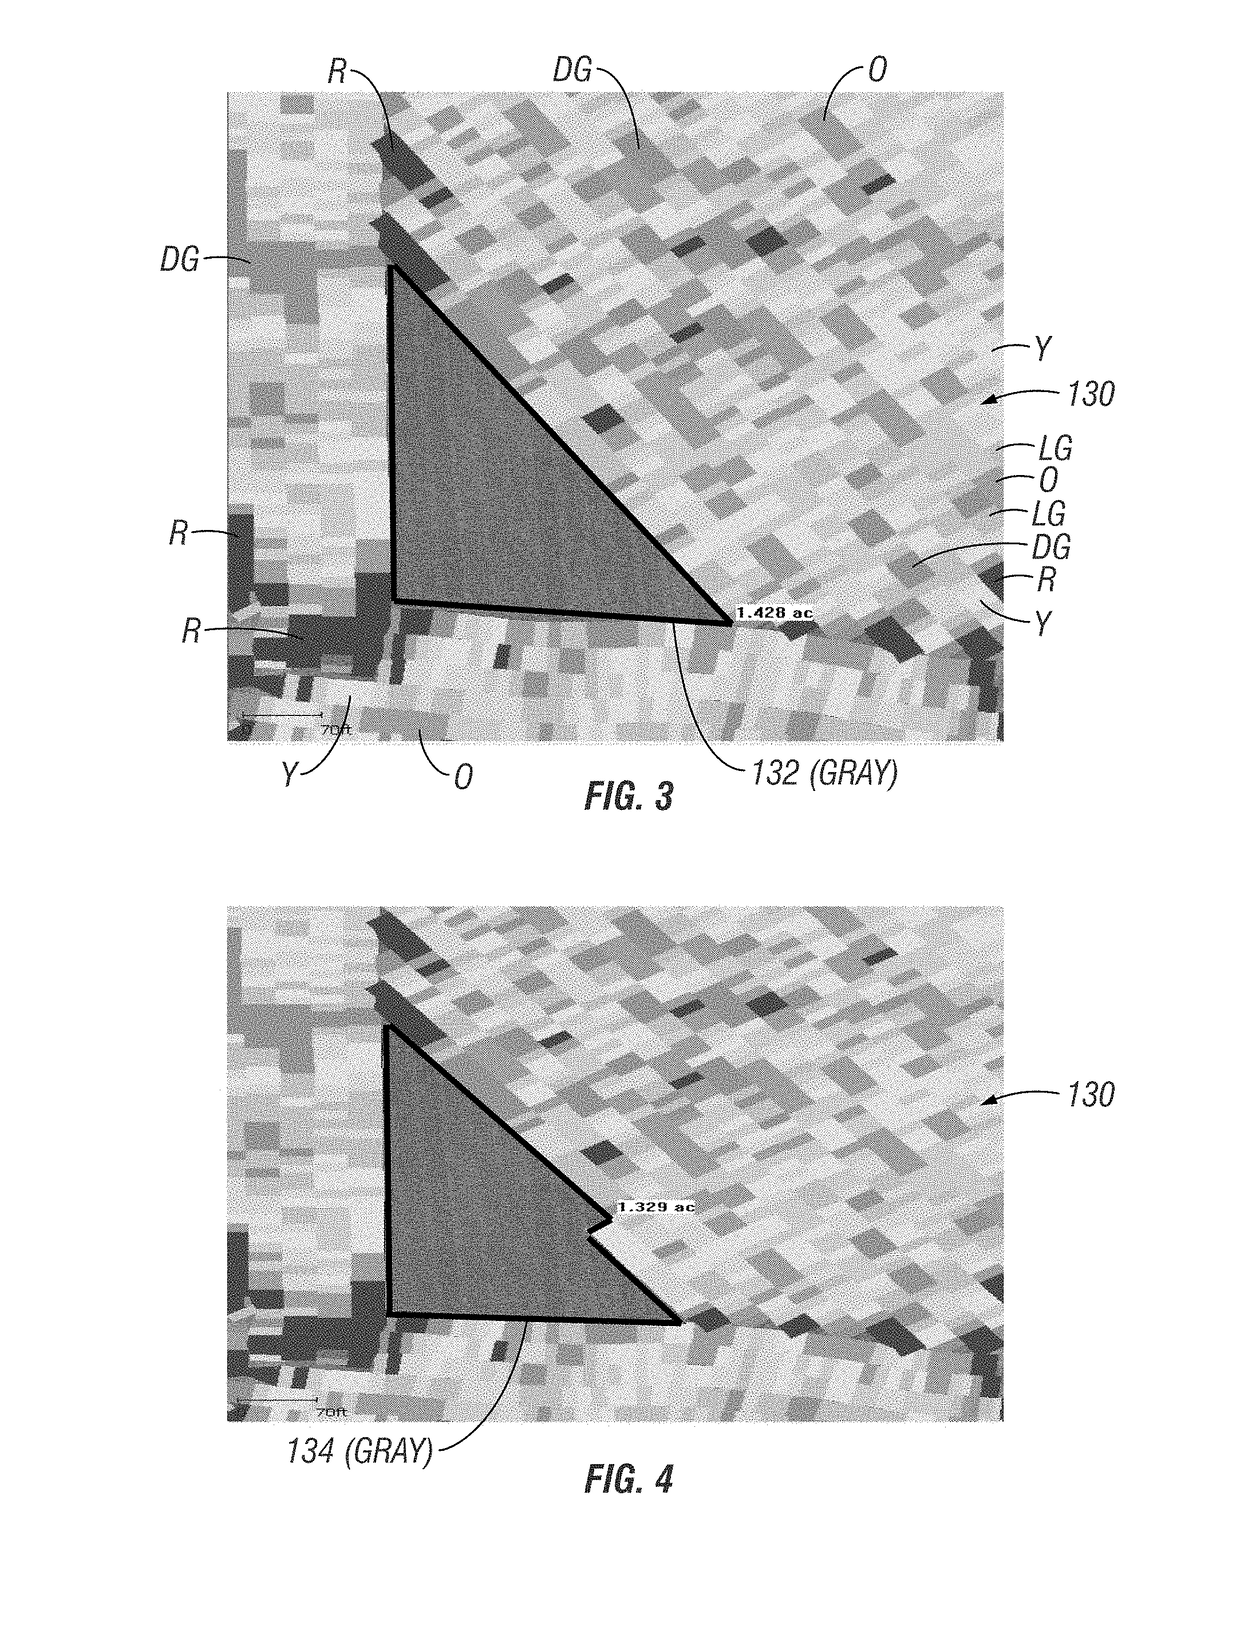
[0036]FIG. 3 illustrates by aerial plan view a field 130 digitally represented on a monitor display with an unharvested area 132 graphically indicated on the display. Based on the geometry and dimensions of the unharvested area the area 132 can be calculated. This can be done by the monitor system by programming and using inputs values such as previously harvested / applied area, swath width, speed, and GPS location. By using this data the system in real time can precisely calculate the area remaining every few seconds. The resolution, accuracy, and precision of the unharvested area can be within the resolution, accuracy, and precision of the technique used to identify the unharvested area. But cruder estimates of area 132 can be made and utilized. For example, if appropriately programming, the person at the display might be able to draw an outline (e.g. by touchscreen drawing tools) of the unharvested portion of the field displayed, as a rougher estimate of that area. The...

example 2

E. Example 2

[0042]FIG. 5 illustrates a yield map 138 for a field (again a digital representation in aerial plan view on a digital display). There are various areas within the field having different yields in a given harvest year (the boundaries of which can indicated by visually or otherwise distinguishable graphics on the display). This includes areas 140, 142, and 144. Area 140 is a portion of the field which has not been harvested yet. Note, in this example, that area 142 has been determined (e.g. by a yield monitor) to have a yield of 150 bushels per acre and area 144 has a yield of 220 bushels per acre. In FIGS. 5-7, yield ranges are color-coded as follows: Dark green (G) highest (including 220 bu / ac); light green (LG) next highest; orange (O) next highest (including 185 bu / ac); yellow (Y) next highest; dark red (R) next highest (including 150 bu / ac). As can be seen, areas of like yields are more amorphous than FIGS. 3 and 4, but tend to occupy more contiguous sub-areas. For ex...

example 3

F. Example 3

[0044]FIG. 8 and FIG. 9 illustrate a yield scenario for a different field 160. In FIG. 8 there is displayed an area to be harvested 166, with areas 162 and 164 on either side. Both area 162 and 164 show low yields (color coding is the same as FIGS. 3-7; (R) indicates red or low yield average of 150 bu / ac; orange (O) and yellow (Y) indicate higher yield, and light green (LG) and green (G) indicate highest. FIG. 9 illustrates the same field in a previous year where yield of area 166 is known. Here, areas 162 and 164 show low yields (150 bushes / acre or color (R)), but area 166 shows a relatively high yield (240 bushels / acre or color (G)).

[0045]Thus the field scenario shown in FIGS. 5-7 and FIG. 8-9 demonstrate how using previous yield data and other parameters can further help predict the yield that is remaining in certain areas of the field and avoid mistakes in estimating or predicting yield. By not only utilizing present year yield measurements of the harvested portion o...


PUM


Abstract

A method for managing agricultural operations by predicting amount of crop or product remaining for a field includes performing agricultural operations on at least a portion of a field using an agricultural machine, sensing data associated with the agricultural operations using sensors associated with the agricultural machine, communicating the data associated with the agricultural operations to a computing device, analyzing the data associated with the agricultural operations performed using the computing device to determine an area prediction for a remaining portion of the field upon which the agricultural operations are to be performed, and using the area prediction for the remaining portion of the field by the computing device to determine a time associated with completing the agricultural operations for the field or an amount of material or other resources associated with completing the agricultural operations for the field.

Description

FIELD OF THE INVENTION[0001]The present invention relates to agriculture technology. More specifically, but not exclusively, the present invention relates to determining the amount of crop or product remaining in a field or determining an amount of an agricultural input yet to be applied to a field.BACKGROUND OF THE ART[0002]For purposes of discussion, problems in the art are discussed with respect to harvesting grain from a field. It is to be understood that although such discussion is useful for background purposes, the present invention is not necessarily limited to this application as there are applications to both removing a crop or product from a field as well as adding an agricultural input to a field.[0003]One of the determinations that is needed during harvest is a determination of how much grain is left in the field. This is useful for scheduling and logistics purposes. Currently, a combine harvester operator can estimate how much grain is left in the field by looking at t...

Claims


Application Information

Patent Timeline
IPC IPC(8): A01B79/00G05B13/02
CPCA01B79/005G05B13/026
Inventor WILSON, DAVID
Owner LEADER TECH
Learn More