Signal inhomogeneity correction and performance evaluation apparatus

a performance evaluation and inhomogeneity correction technology, applied in the field of magnetic resonance (mr) systems and methods, can solve the problems of poor validity scores and inability to direct evaluation, and achieve the effect of improving the detection sensitivity of pathophysiological changes and improving the accuracy and precision of mr imaging

Active Publication Date: 2019-04-02
YALE UNIV +1
View PDF28 Cites 5 Cited by
  • Summary
  • Abstract
  • Description
  • Claims
  • Application Information

AI Technical Summary

Benefits of technology

[0007]The present disclosure is directed to a novel in vivo method for correcting MR signal inhomogeneity. The inhomogeneities caused by transmit field and receiver sensitivity are quantified separately and used to perform inhomogeneity correction. The method can enhance the accuracy and precision of MR imaging and MR spectroscopy techniques and improve the detection sensitivity of pathophysiological changes. To investigate the consistencies among different algorithms and to provide end users with a rational basis for selecting a specific inhomogeneity correction method for a certain scientific application, the present disclosure also includes the method and apparatus to evaluate the performance of various signal inhomogeneity correction methods.
[0011]Thus, in accordance with other aspects of the disclosure, there is described a method that may include: producing a set of signal intensity images of a uniform phantom using various sequences and imaging parameters in vivo; evaluating the performance of signal inhomogeneity correction methods; producing a set of signal intensity images of phantoms with multiple contrasts (representing multiple tissue types) and in vivo human bodies using various sequences and imaging parameters in vivo; measuring the exact volume of each tissue component to serve as the ground-truth using physical and chemical methods; correcting signal inhomogeneities with various methods and different parameters; segmenting the corrected images and estimating the volume of each tissue component; and evaluating the performance or image quality of various methods by comparing tissue volumes, contrasts, signal intensities and noises estimated from the segmentations and those obtained from the physical and chemical methods. The best method will have the best image quality, such as the smallest standard deviation of signal intensity for the uniform phantom and the largest contrast or contrast-to-noise of the multiple tissue phantoms. Additionally, it will be robust and less variable across sequences and imaging parameters.

Problems solved by technology

Due to the lack of ground-truth, a direct evaluation is not feasible.
However, because it is difficult to describe MR scanner procedures exactly, most existing performance evaluation methods yield poor validity scores and often lead to conflicting statements.

Method used


Image

  • Signal inhomogeneity correction and performance evaluation apparatus
  • Signal inhomogeneity correction and performance evaluation apparatus
  • Signal inhomogeneity correction and performance evaluation apparatus

Examples


Embodiment Construction

Introduction

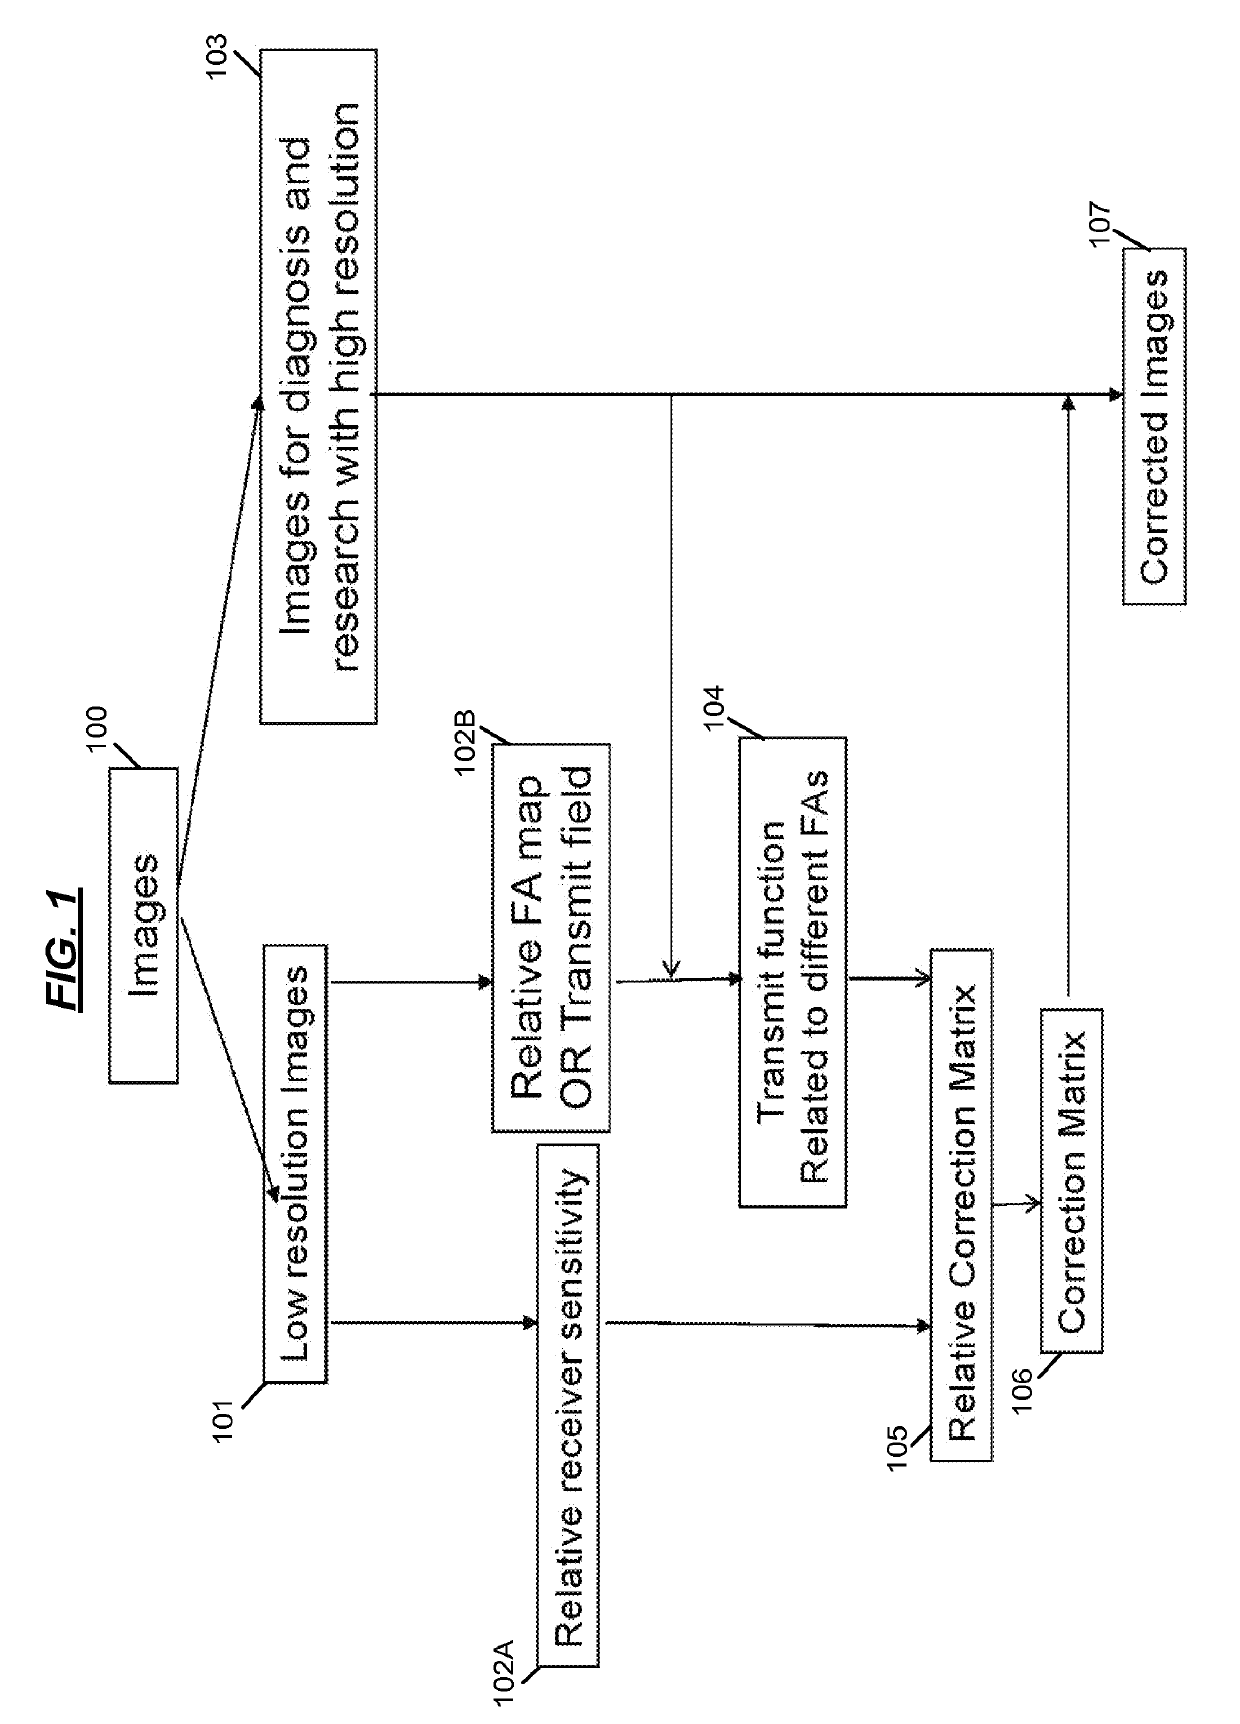
[0027]The present disclosure describes methods for correcting image inhomogeneity using a correction matrix of the to-be-corrected images:

SIcorrected=SImeasured / SIcorrection,  (1)

Where SICorrected is the corrected signal, signal SImeasured is the measured signal, and SICorrected is the correction matrix of the to-be-corrected images. The correction matrix or bias field can be calculated from transmit function and receiver sensitivity as follows:

SIcorrection=F(x)·S(x),  (2)

where F(x) is the corresponding transmit function, and S(x) is receiver sensitivity. The transmit function of the to-be-corrected image F(x) is calculated according to the measured transmit field and Bloch's equation that corresponds to the acquired image.

[0028]1. Single Radiofrequency Pulse

[0029]The simplest MRI radiofrequency pulse only includes a type of radiofrequency pulse shape which can be one of sinc pulse, Gaussian pulse, truncated-sinc, hard pulse, composite pulse and tailored pulse. For a giv...


PUM


Abstract

Methods for correcting inhomogeneities of magnetic resonance (MR) images and for evaluating the performance of the inhomogeneity correction. The contribution of both transmit field and receiver sensitivity to signal inhomogeneity have been separately considered and quantified. As a result, their negative contributions can be fully corrected. The correction method can greatly enhance the accuracy and precision of MRI techniques and improve the detection sensitivity of pathophysiological changes. The performance of signal inhomogeneity correction methods has been evaluated and confirmed using phantom and in vivo human brain experiments. The present methodologies are readily applicable to correct signal intensity inhomogeneity artifacts produced in different imaging modalities, such as computer tomography, X-ray, ultrasound, and transmission electron microscopy.

Description

TECHNICAL FIELD OF THE DISCLOSURE[0001]The field of the disclosure is Magnetic Resonance (MR) systems and methods and, more particularly, systems for correcting signal intensity inhomogeneity caused by non-tissue characteristics.BACKGROUND OF THE DISCLOSURE[0002]Inhomogeneity caused by non-tissue characteristics is an undesired and unavoidable artifact, which often adversely affects intensity-based qualitative and quantitative MR image analysis. It becomes more severe in higher magnetic fields and for objects with higher permittivity where the wavelength of the RF field in the objects is comparable with or less than the size of the objects. In MR imaging, imperfections of receiver and transmit coils, static magnetic field inhomogeneity, radio frequency (RF) penetration, gradient-driven eddy currents, and object-dependent electromagnetic interactions systematically cause the variations of signal intensities across images which is also referred as bias field, intensity non-uniformity,...

Claims


Application Information

Patent Timeline
Patent Type & Authority Patents(United States)
IPC IPC(8): G01R33/565G01R33/48G01R33/24G01R33/485G01R33/58
CPCG01R33/5659G01R33/246G01R33/586G01R33/4806G01R33/4818G01R33/485
Inventor WANG, JINGHUALU, ZHONG-LINCONSTABLE, ROBERT TODD
Owner YALE UNIV
Why Eureka
Try Eureka