Chemotherapy regimen selection
a chemotherapy regimen and chemotherapy technology, applied in the field of cancer therapy, can solve the problems of inability to detect cancer cells, and inability to detect cancer cells, and achieve the effects of achieving the highest probability of pcr, and improving the current rate of pcr
- Summary
- Abstract
- Description
- Claims
- Application Information
AI Technical Summary
Benefits of technology
Problems solved by technology
Method used
Image
Examples
example 1
Materials and Methods
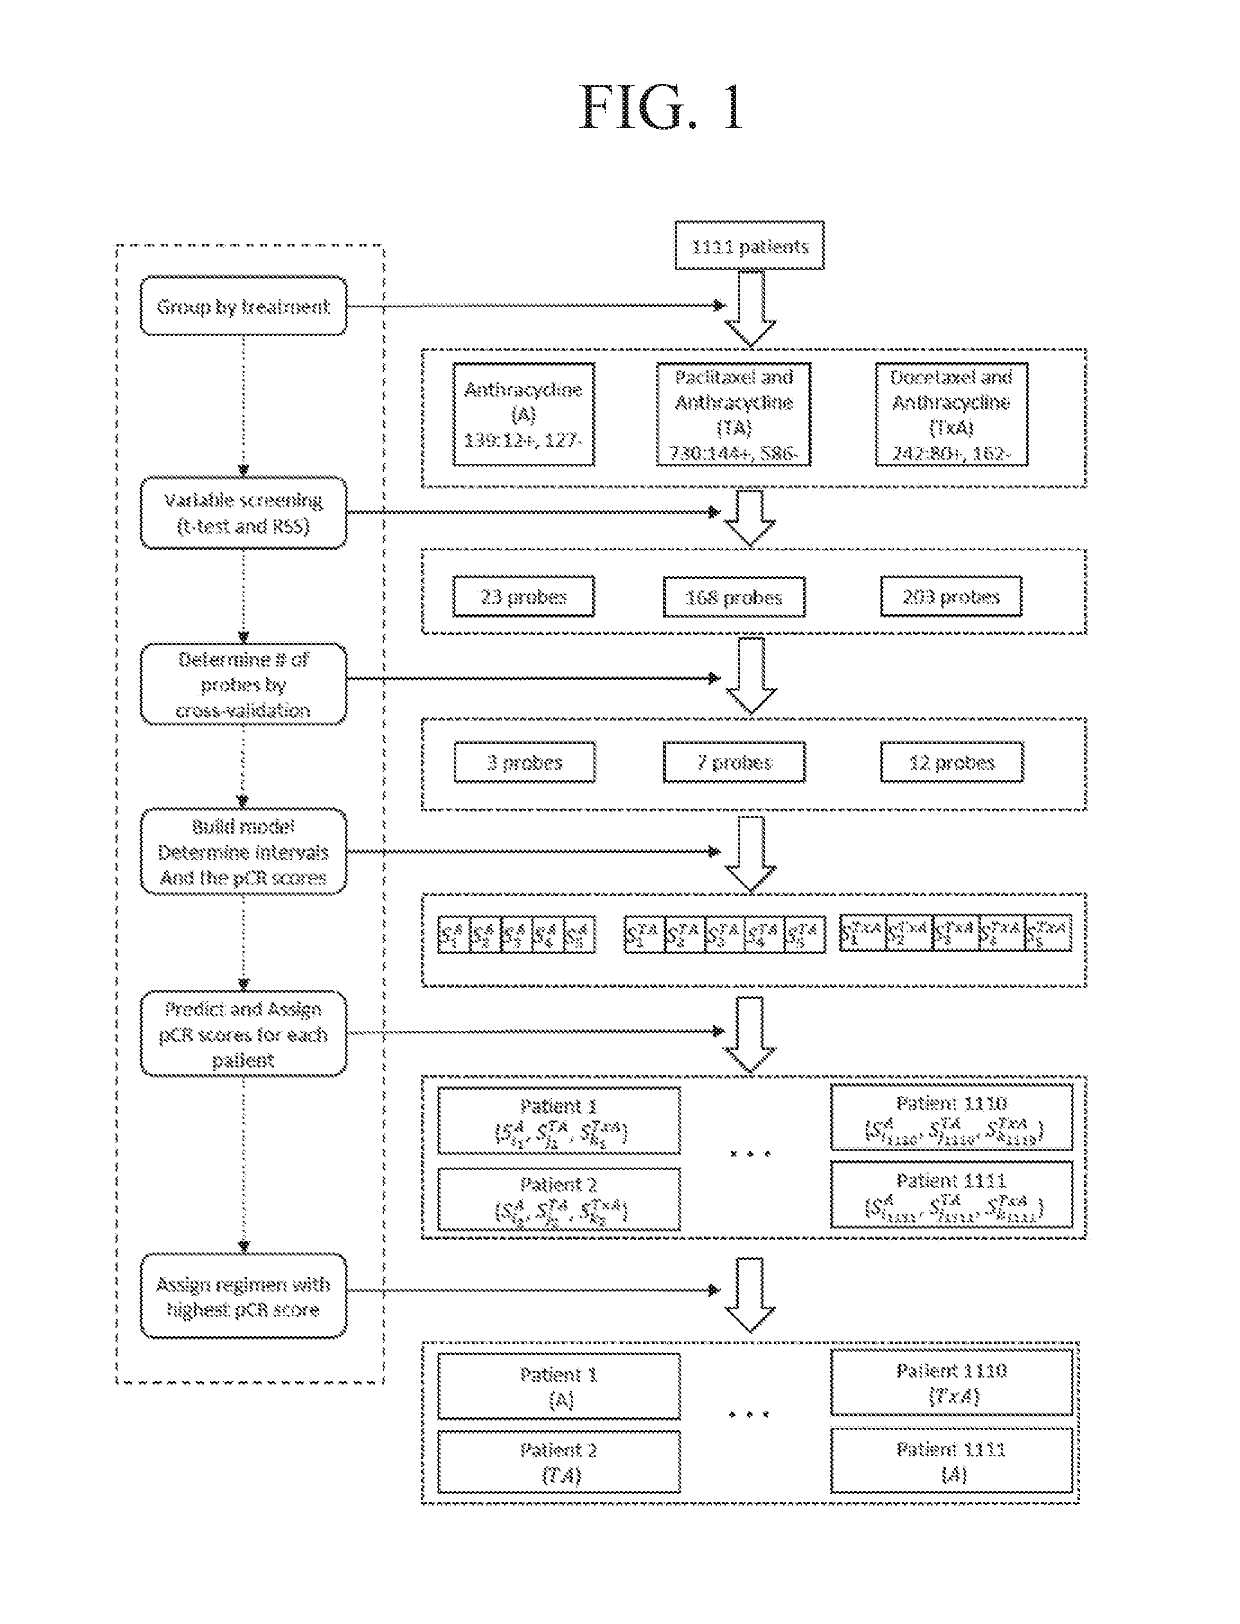
[0295]1111 breast cancer tumor samples were collected from 7 data series in GEO database (Gene Expression Omnibus (Takada, et al., 2012, Albain, et al., 2010)) (Table 2). Samples were grouped into 3 treatment groups: A group (anthracycline only), TA group (paclitaxel and anthracycline), and TxA group (docetaxel and anthracycline). R (Liu, et al., 2012) package Affyio (Edgar, et al., 2002) was used to read and normalize the Affymetrix® data. The responses for all samples were coded as pathological complete response (pCR) or Residual Disease (RD).
[0296]
TABLE 2GEO Data Sets Used and Number of Patients in Each Data Set *TreatmentGEOPaclitaxel andDocetaxel andAccessionAnthracyclineAnthracyclineAnthracyclineNumber(A)(TA)(TxA)TotalGSE201944 (0)257 (20.6%)8 (12.5%)269 (20.1%)(Popovici, et al.,2010)GSE2027185 (8.2%)91 (20.9%)—176 (14.8%)(Tabchy, et al.,2010)GSE2209350(10%)——50 (10%)(iwamoto, et al.,2011)GSE23988——61 (32.8%)61 (32.8%)(Iwamoto, et al.,2011)GSE25055—290 (18...
example 2
Results for the Entire Population
Model Performance and Gene Signatures
[0312]The performance of the three types of models for the three types of regimens is shown in Table 3. Models with both clinical and genetic variables (clinical-gene models) generally perform better than models with only clinical variables (clinical models) and models with only genetic variables (gene models). Addition of genetic variables improved the performance for TA and TxA groups dramatically, while the three models did not show significant differences for A group. For TA and TxA groups, both gene models and clinical-gene models performed much better than clinical models, indicating genetic variables can be powerful predictors of chemotherapy responses. Based on this comparison, clinical-gene models were used in the rest of this study. The gene signatures that were responsible for the treatment responses of each regimen are shown in Table 4. The gene signatures consist of 3, 5, and 11 genes for A, TA, and T...
example 3
Results for the HER2-Negative Subpopulation
[0331]The performance of the three types of models for the three types of regimens is shown in Table 9. The predicted probabilities of each model were first sorted and then divided into 5 equally numerous intervals (Table 10). A manual approach to make the probabilities covered by each interval less skewed while at the same time keeping enough patients in each interval to make the estimated pCR scores reliable was used to investigate how division of intervals affects the expected pCR. The intervals are shown in Table 11. The patients were assigned based on these intervals and the results are shown in Table 12. The expected number of pCR was only slightly higher than that achieved using intervals based on quintiles.
[0332]
TABLE 9Model Performance for the HER2-negative SubpopulationGenes and Clinical variablesclinical variablesGenesGroup (# off1-f1-f1-probes)scorePrecisionrecallscorePrecisionrecallscorePrecisionrecallAnthra-0.5560.8330.4170.51...
PUM
 Abstract
Description
Claims
Application Information
 - R&D
- Intellectual Property
- Life Sciences
- Materials
- Tech Scout
- Unparalleled Data Quality
- Higher Quality Content
- 60% Fewer Hallucinations
Browse by: Latest US Patents, China's latest patents, Technical Efficacy Thesaurus, Application Domain, Technology Topic, Popular Technical Reports.
© 2025 PatSnap. All rights reserved.Legal|Privacy policy|Modern Slavery Act Transparency Statement|Sitemap|About US| Contact US: help@patsnap.com


