
Classifying nuclei in histology images

a nucleus and image technology, applied in image analysis, instruments, computing, etc., can solve the problems of difficult, if not impossible, manual assessment of images by pathologists, and achieve superior classification results, improve nucleus classification accuracy, and improve the effect of nucleus classification

Active Publication Date: 2020-04-21
VENTANA MEDICAL SYST INC
View PDF24 Cites 6 Cited by
  • Summary
  • Abstract
  • Description
  • Claims
  • Application Information

AI Technical Summary

Benefits of technology

[0017]A “foreground segmentation mask” is, for example, an image mask created by a segmentation algorithm that allows separating one or more pixel blobs (to be used as “foreground pixels”) from other pixels (constituting the “background”). For example, the foreground segmentation mask may be generated by a nuclear segmentation algorithm and the application of the foreground segmentation mask on an image depicting a tissue section may allow identification of nuclear blobs in an image.
[0020]In some embodiments, a filter bank comprising “maximum response” (MR) filters can be used. A maximum response filter bank is a filter bank comprising multiple copies of at least one filter of a particular type, each copy being oriented differently. By applying the multiple copies of said particular filter at different rotation angles on pixel intensities of an image or image regions, the one of said different orientations is identified where the filter application returned the largest signal. The MR filter set may thus allow to identify an angle for a particular nucleus of interest at which a particular filter type returned a maximum signal and to solely consider the filtered image provided by said particular filter for further analysis. Alternatively, the angle may be used for aligning the filtered image or any derivative data value to other features extracted from the image in a way to achieve rotational invariance of the filtering results. Thus, using an MR filter bank may comprise MR filters being able to record the angle of maximum response which allows the computation of higher order co-occurrence statistics on orientation which may be used as a texture feature metrics. Using MR filter banks capable of recording the angle of the maximum response allow generating more significant textons by mapping rotated features to the same texton, thereby reducing the dimensions of the feature space to be considered during the clustering.
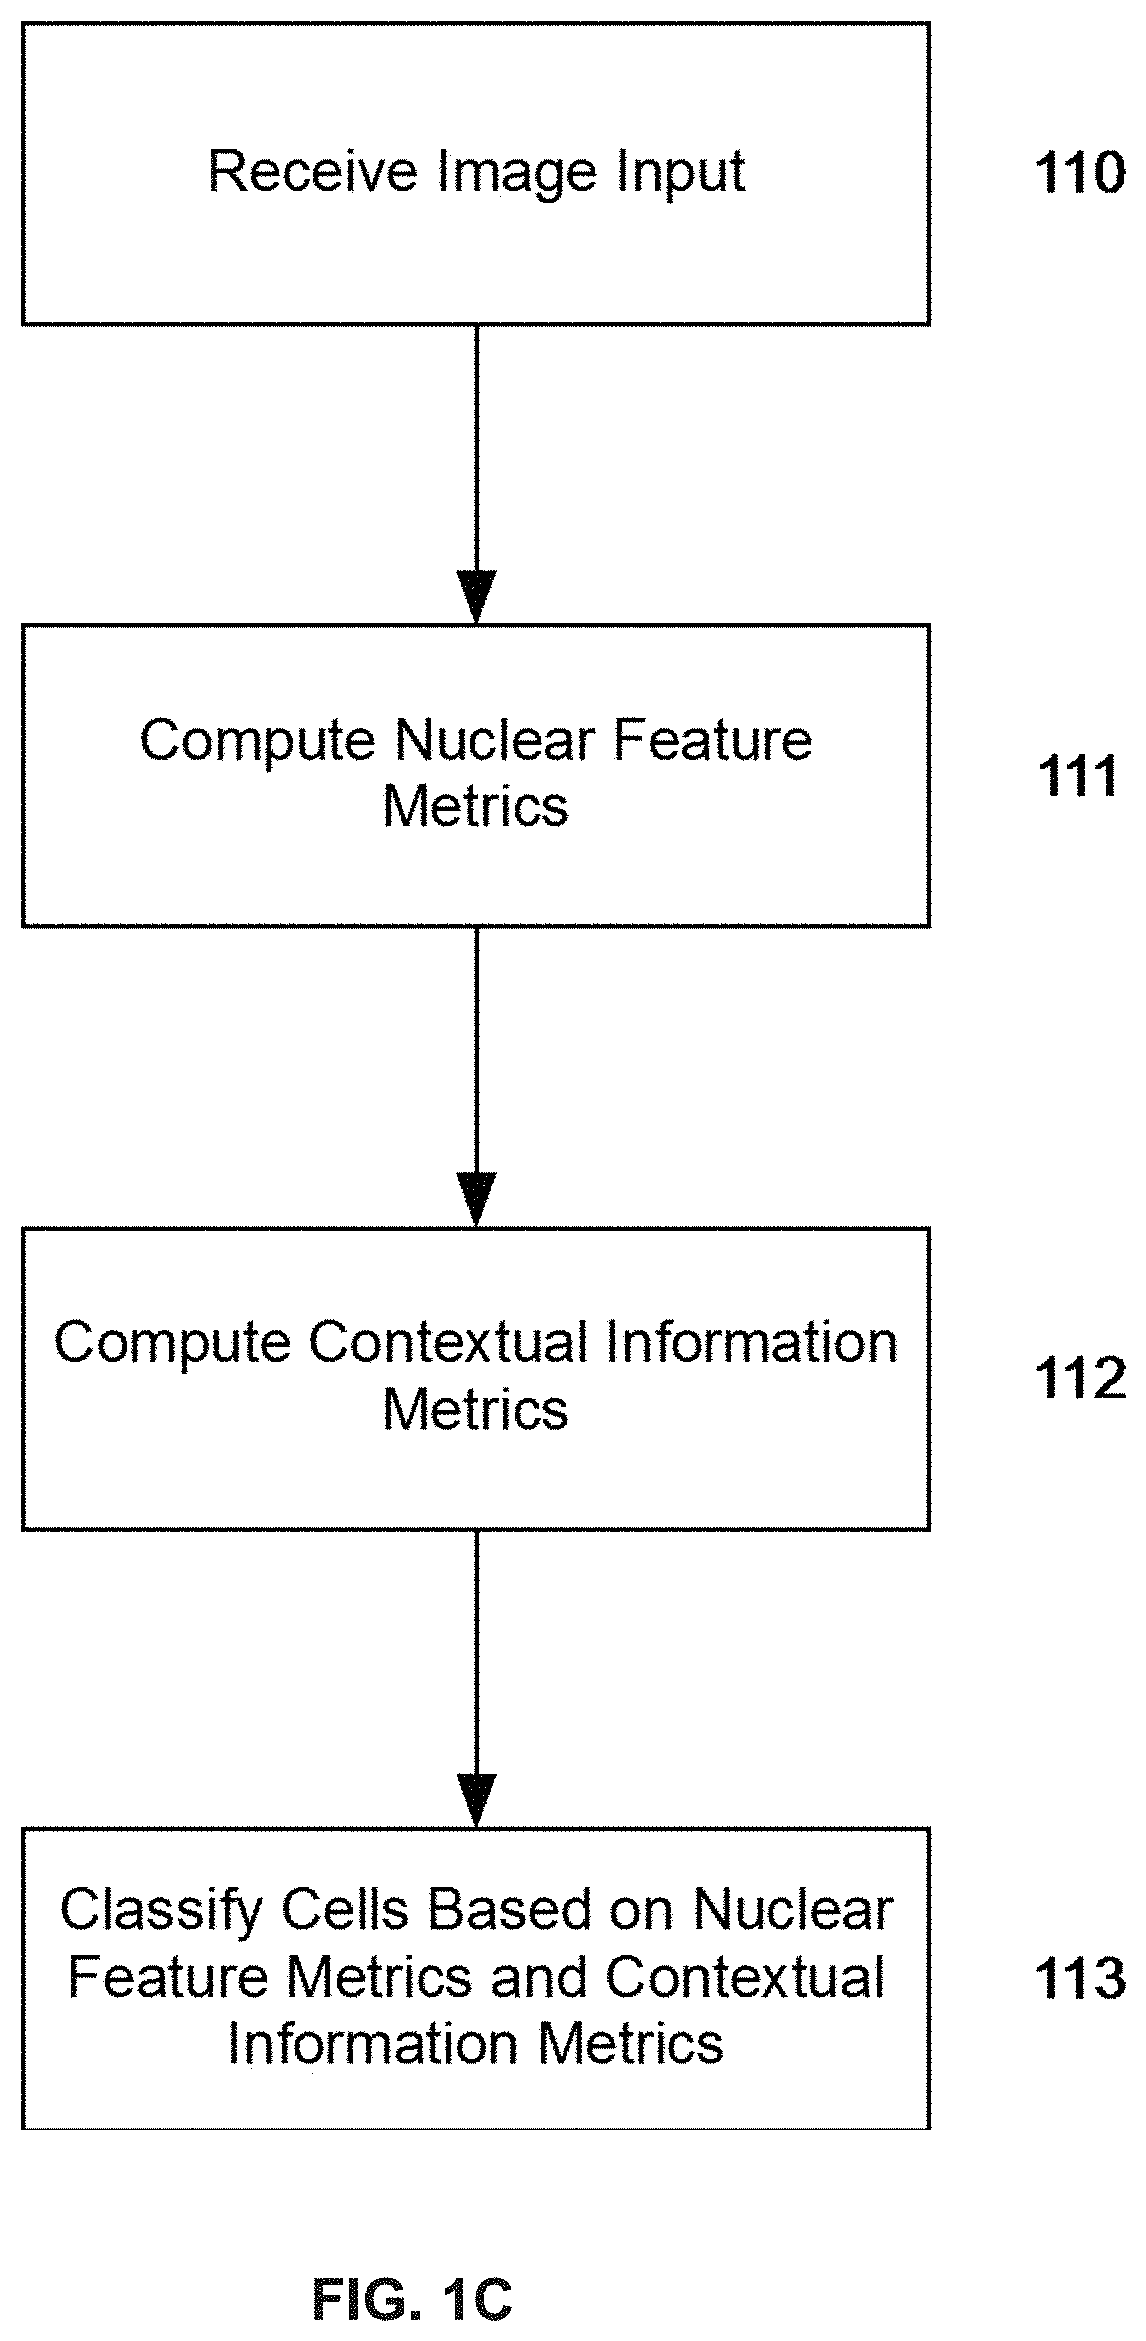
[0035]Applicants have shown that the presently disclosed method provides superior results as compared to prior art methods. Applicants have performed extensive experimental evaluations to show that contextual information is useful for the classification of the nuclei in PD-L1 stained images when combined with a set of traditional nuclear features. Indeed, the use of contextual information metrics in conjunction with nuclear metrics provides an improvement in nucleus classification accuracy as compared with the prior art, where cells were classified exclusively with nuclear metric features. Applicants have also demonstrated several methods of deriving the contextual information metrics, which when combined with the nuclear feature metrics, provides comparatively superior classification results as compared with the prior art. Applicants have therefore developed a method that allows for automated classification of nuclei in PD-L1 stained tissue images, where the method identifies each nucleus based on its own appearance (nuclear feature metrics) and the appearance of cells in its local tissue context (contextual information metrics). It has been observed that the accuracy for PD-L1 stained tissue images is particularly high, as PD-L1 is also expressed in the cell membrane and intensity information on the region surrounding a nucleus may thus help in accurately classifying cells into PD-L1 positive and PD-L1 negative cells.

Problems solved by technology

Due to the large size of a whole slide image at high magnification and the large volume of data to be processed, assessment of the images by a pathologist is problematic.
Indeed, the number of cells or cell nuclei present in a whole slide tissue image is typically of the order of 104, making it difficult, if not infeasible, for a pathologist to manually perform such a task.

Method used


Image

  • Classifying nuclei in histology images
  • Classifying nuclei in histology images
  • Classifying nuclei in histology images

Examples


example 1

[0143]A comprehensive evaluation was performed using a nucleus database with the nuclei detected from tumor-burdened tissue from PD-L1-stained lung samples. Slides were scanned on VENTANA iScan HT scanners, resulting in RGB whole slide images with 0.465 μm pixel size.

[0144]For these PD-L1-stained tissue images (see FIGS. 7A and 7B), five different types of nuclei needed to be classified. The PD-L1 database included 256 images of 600×700 pixels, which were obtained from PD-LI-stained lung samples. The slides were again scanned on VENTANA iScan HT scanners, resulting in RGB whole slide images with 0.465 μm pixel size. From these images, a number of nuclei of five types were selected by a pathologist, including nuclei from PD-LI-positive tumor cells (2,414), from PD-LI-negative tumor cells (1,620), from PD-LI-positive lymphocytes (2,851), from non-target staining cells (1,753), and from the remaining PD-LI-negative cells (1,834) (FIGS. 7A and 7B). These are PD-L1-positive tumor nuclei,...

example 2

[0150]An example for the scoring of a PD-L1-stained slide is shown in FIGS. 11A-D. The digital image of a tissue specimen immunohistochemically stained with PD-L1 (labeled with DAB in brown) and the counterstain hematoxylin is shown in FIGS. 11A and 11B. An automated analysis implementing the disclosed method has detected cells individually (not seen in this resolution) and labeled them as one of a PD-L1-positive tumor cell, a PD-L1-negative tumor cell, a PD-L1-positive lymphocyte, or any other cell. From these automatically generated read-outs, the tissue on this slide was scored individually for its PD-L1 status with respect to immune and immune cells. To score the tumor cells, the fraction of PD-L1-positive tumor cells is divided by the total number of tumor cells (i.e., PD-L1 positive and PD-L1 negative tumor cells). The tissue on this slide was scored as about 90% of the tumor cells being positive for PD-L1. To score the immune cells, the area in the image that contains these c...


PUM


Abstract

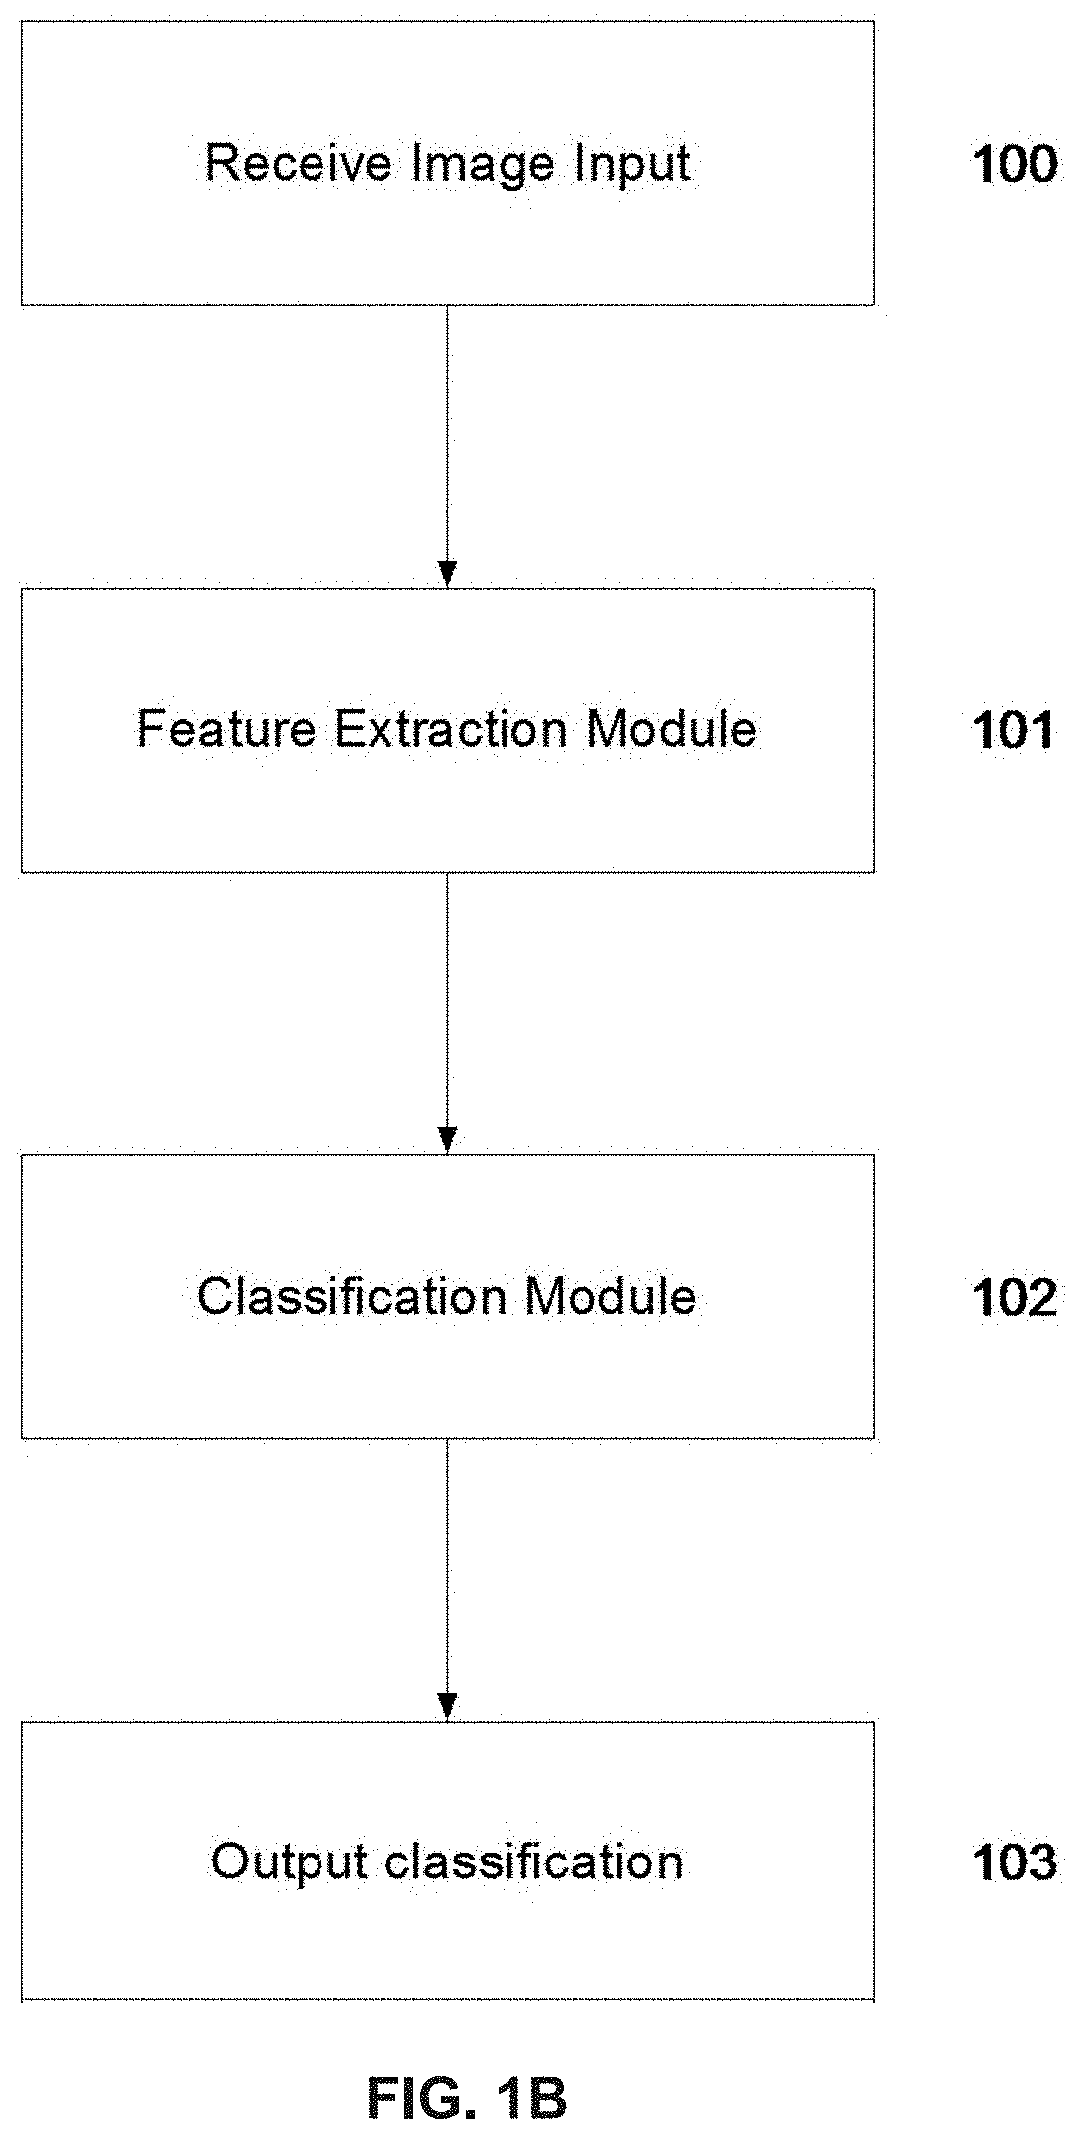
Disclosed, among other things, is a computer device and computer-implemented method of classifying cells within an image of a tissue sample comprising providing the image of the tissue sample as input; computing nuclear feature metrics from features of nuclei within the image; computing contextual information metrics based on nuclei of interest with the image; classifying the cells within the image using a combination of the nuclear feature metrics and contextual information metrics.

Description

CROSS REFERENCE TO RELATED APPLICATIONS[0001]This present application is a continuation of International Patent Application No. PCT / EP2015 / 076105 filed Nov. 9, 2015, which claims priority to and the benefit of U.S. Provisional Patent Application 62 / 144,364 filed Apr. 8, 2015, and the benefit of U.S. Provisional Patent Application No. 62 / 077,536 filed Nov. 10, 2014. Each of the above patent applications is incorporated herein by reference as if set forth in its entirety.BACKGROUND[0002]The automated identification of biological structures from histopathology images is a central task in digital pathology. Given a whole slide tissue image, many applications require identification of different types of cells or other structures in the images that appear in normal tissue, tumor tissue, necrosis, lymphatic regions, and stroma. In fact, a quantitative assessment of the presence of such cells or structures in a sample is often needed to determine the impact of a particular therapy, such as ...

Claims


Application Information

Patent Timeline
Patent Type & Authority Patents(United States)
IPC IPC(8): G06K9/46G06T7/00G06K9/20G06K9/00G06K9/62G06V10/50
CPCG06K9/20G06K9/4642G06T7/00G06K9/0014G06K9/00147G06K9/4604G06K9/6269G06K9/6223G06V20/695G06V20/698G06V10/50G06F18/23213G06F18/2411
Inventor BREDNO, JOERGCHEFD'HOTEL, CHRISTOPHENGUYEN, KIEN
Owner VENTANA MEDICAL SYST INC
Learn More