Systems and methods for distributed-solar power forecasting using parameter regularization

a distributed solar and parameter regularization technology, applied in the field of distributed solar power forecasting, can solve the problems of compromising the computational efficiency of the models to achieve higher accuracy, not producing accurate forecasts, etc., and achieve the effects of reducing correlations, improving accuracy, and reducing parameters

Active Publication Date: 2021-08-31
UTOPUS INSIGHTS INC
View PDF19 Cites 2 Cited by
  • Summary
  • Abstract
  • Description
  • Claims
  • Application Information

AI Technical Summary

Benefits of technology

[0003]An example non-transitory computer readable medium comprising executable instructions, the executable instructions being executable by one or more processors to perform a method, the method comprising receiving first historical meso-scale numerical weather predictions (NWP) for a first geographic distribution area for a first time period, receiving first power flow information for the first geographic distribution area of the first time period, correcting for overfitting of the first historical meso-scale NWP predictions to reduce correlations within the first historical meso-scale NWP predictions and improve accuracy and create first corrected historical meso-scale NWP predictions, reducing parameters in the first corrected historical meso-scale NWP predictions to improve scalability and create first reduced, corrected historical meso-scale NWP predictions, training first power flow models using the first reduced, corrected historical meso-scale NWP predictions and the first power flow information for all or parts of the first geographic distribution area, receiving first current meso-scale numerical weather predictions (NWP) for the first geographic distribution area for a first future time period, applying any number of first power flow models to the first current meso-scale numerical weather predictions (NWP) to generate any number of power flow predictions that predict power flow within or from portions of the first geographic distribution area, comparing one or more of the any number of power flow predictions to one or more first thresholds to determine significance of reverse power flows, and generating a first report including at least one prediction of the reverse power flow based on the comparison and identifying the first geographic distribution area that may be impacted by the at least one prediction of the reverse power flow.
[0005]In some embodiments, the method further comprises receiving second historical meso-scale numerical weather predictions (NWP) for a second geographic distribution area for a first time period, receiving second power flow information for the second geographic distribution area of the first time period, correcting for overfitting of the second historical meso-scale NWP predictions to reduce correlations within the second historical meso-scale NWP predictions and improve accuracy and create second corrected historical meso-scale NWP predictions, reducing parameters in the second corrected historical meso-scale NWP predictions to improve scalability and create second reduced, corrected historical meso-scale NWP prediction, training second power flow models using the second reduced, corrected historical meso-scale NWP predictions and the second power flow information for all or parts of the second geographic distribution area, the training of the second power flow models being at substantially a similar time as training the first power flow models due to improved scalability of model creation, receiving second current meso-scale numerical weather predictions (NWP) for the second geographic distribution area for a second future time period, applying any number of second power flow models to the second current meso-scale numerical weather predictions (NWP) to generate any number of power flow predictions that predict power flow within or from portions of the second geographic distribution area, comparing one or more of the any number of power flow predictions to one or more second thresholds to determine significance of reverse power flows, and generating a second report including at least one prediction of the reverse power flow based on the comparison and identifying the second geographic distribution area that may be impacted by the at least one prediction of the reverse power flow.
[0009]An example system comprises at least one processor and memory containing instructions, the instructions being executable by the at least one processor to: receive a first historical meso-scale numerical weather predictions (NWP) for a first geographic distribution area for a first time period, receive first power flow information for the first geographic distribution area of the first time period, correct for overfitting of the first historical meso-scale NWP predictions to reduce correlations within the first historical meso-scale NWP predictions and improve accuracy and create first corrected historical meso-scale NWP predictions, reduce parameters in the first corrected historical meso-scale NWP predictions to improve scalability and create first reduced, corrected historical meso-scale NWP predictions, train first power flow models using the first reduced, corrected historical meso-scale NWP predictions and the first power flow information for all or parts of the first geographic distribution area, receive first current meso-scale numerical weather predictions (NWP) for the first geographic distribution area for a first future time period, apply any number of first power flow models to the first current meso-scale numerical weather predictions (NWP) to generate any number of power flow predictions that predict power flow within or from portions of the first geographic distribution area, compare one or more of the any number of power flow predictions to one or more first thresholds to determine significance of reverse power flows, and generate a first report including at least one prediction of the reverse power flow based on the comparison and identifying the first geographic distribution area that may be impacted by the at least one prediction of the reverse power flow.
[0010]An example method comprises receiving first historical meso-scale numerical weather predictions (NWP) for a first geographic distribution area for a first time period, receiving first power flow information for the first geographic distribution area of the first time period, correcting for overfitting of the first historical meso-scale NWP predictions to reduce correlations within the first historical meso-scale NWP predictions and improve accuracy and create first corrected historical meso-scale NWP predictions, reducing parameters in the first corrected historical meso-scale NWP predictions to improve scalability and create first reduced, corrected historical meso-scale NWP predictions, training first power flow models using the first reduced, corrected historical meso-scale NWP predictions and the first power flow information for all or parts of the first geographic distribution area, receiving first current meso-scale numerical weather predictions (NWP) for the first geographic distribution area for a first future time period, applying any number of first power flow models to the first current meso-scale numerical weather predictions (NWP) to generate any number of power flow predictions that predict power flow within or from portions of the first geographic distribution area, comparing one or more of the any number of power flow predictions to one or more first thresholds to determine significance of reverse power flows, and generating a first report including at least one prediction of the reverse power flow based on the comparison and identifying the first geographic distribution area that may be impacted by the at least one prediction of the reverse power flow.

Problems solved by technology

The prior art has a problem of forecasting net renewable power generation dispersed in a power distribution territory while making the forecasting models computationally scalable and accurate.
Existing methods of solving this problem either do not produce accurate forecasts (leading to unpredictable reverse power flows through power substations) or compromise the computational efficiency of the models for achieving higher accuracy.

Method used


Image

  • Systems and methods for distributed-solar power forecasting using parameter regularization
  • Systems and methods for distributed-solar power forecasting using parameter regularization
  • Systems and methods for distributed-solar power forecasting using parameter regularization

Examples


Embodiment Construction

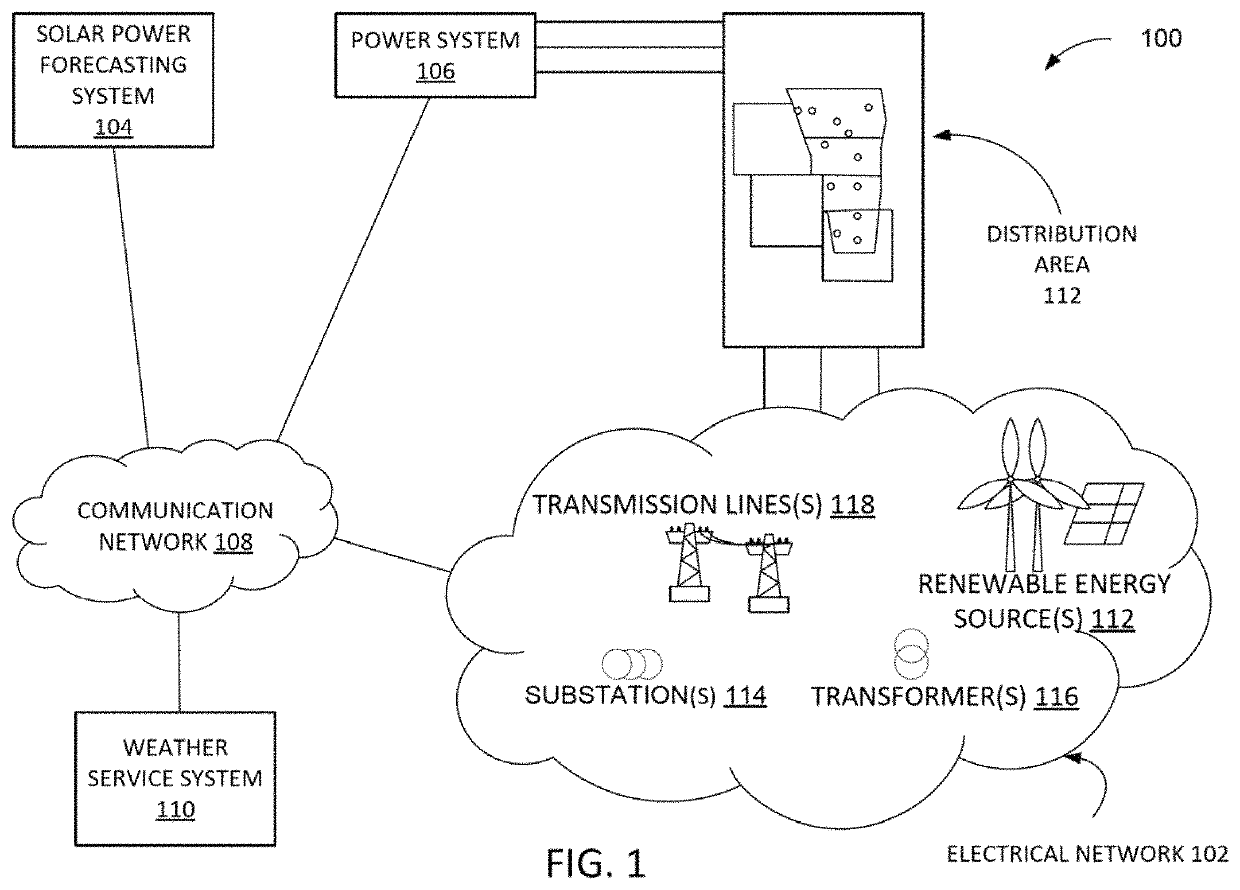
[0025]Various embodiments described herein discuss forecasting net renewable power generation dispersed in a power distribution territory while making the power forecasting models computationally scalable and accurate. The process may produce accurate power forecasts to avoid unpredictable reverse power flows through power substations and improve computational efficiency of the models for achieving higher accuracy.

[0026]Solar power generation examples are discussed herein, where the net-generation includes both stand-alone PV (Photo-Voltaic) farms and roof-top PV installed by residential customers. In some embodiments, systems and methods discussed herein may be utilized to forecast net-generation of roof-top PV, stand-alone PV farms, or a combination of the two. For example, systems and methods discussed herein may be utilized to forecast net-generation of roof-top PV without accounting for stand-alone PV farms and / or other types of renewable energy assets (e.g., wind turbines).

[00...


PUM


Abstract

An example method comprises receiving first historical meso-scale numerical weather predictions (NWP) and power flow information for a geographic distribution area, correcting for overfitting of the historical NWP predictions, reducing parameters in the first historical NWP predictions, training first power flow models using the first reduced, corrected historical NWP predictions and the historical power flow information for all or parts of the first geographic distribution area, receiving current NWP predictions for the first geographic distribution area, applying any number of first power flow models to the current NWP predictions to generate any number of power flow predictions, comparing one or more of the any number of power flow predictions to one or more first thresholds to determine significance of reverse power flows, and generating a first report including at least one prediction of the reverse power flow and identifying the first geographic distribution area.

Description

FIELD OF THE INVENTION[0001]Embodiments of the present invention(s) relate generally to distributed solar power forecasting in electrical networks. In particular, the present invention(s) relate to distributed solar power forecasting to multiple portions of a distributed geographic area using numerical weather prediction with improved accuracy and scalability in electrical networks.DESCRIPTION OF RELATED ART[0002]Home and commercial solar panel installations have become ubiquitous. The prior art has a problem of forecasting net renewable power generation dispersed in a power distribution territory while making the forecasting models computationally scalable and accurate. Existing methods of solving this problem either do not produce accurate forecasts (leading to unpredictable reverse power flows through power substations) or compromise the computational efficiency of the models for achieving higher accuracy.SUMMARY[0003]An example non-transitory computer readable medium comprising ...

Claims


Application Information

Patent Timeline
Patent Type & Authority Patents(United States)
IPC IPC(8): G01W1/10H02J3/38G08B21/18
CPCG01W1/10G08B21/18H02J3/383G01W2203/00H02J2203/20H02S50/00Y02E10/56G08B21/182H02J3/004H02J3/381H02J2300/24Y04S10/50H02J3/38
Inventor SHUKLA, SRIVATSKIM, YOUNGHUNDENG, AIJUN
Owner UTOPUS INSIGHTS INC
Why Eureka
Try Eureka