Eureka AIR delivers breakthrough ideas for toughest innovation challenges, trusted by R&D personnel around the world.

Target molecule density determination in a fluorescence image

a fluorescence image and target molecule technology, applied in the field of image analysis, can solve the problems of inability to accurately compare expression levels, inability to accurately quantify the effect of a particular anti-, and both methods tend to be complex

Active Publication Date: 2022-07-12
F HOFFMANN LA ROCHE & CO AG
View PDF19 Cites 0 Cited by
  • Summary
  • Abstract
  • Description
  • Claims
  • Application Information

AI Technical Summary

Benefits of technology

[0019]Embodiments of the invention may have the advantage that—by using a new form of slide that comprises a fluoro dot and a target dot as described above and by using density information of the fluorescence-inducing molecules or target molecules in the respective dots—it is now possible to calibrate the intensity information of a fluorescence image in a way that the absolute number of target molecules in a tissue sample depicted in a fluorescence image can accurately and exactly be determined fully automatically by means of an image analysis method.
[0108]A “tyramide signal amplification staining protocol”, also called “TSA assay” or “CARD” for Catalyzed Reporter Deposition, is an enzyme-mediated detection method that utilizes the catalytic activity of an enzyme (typically horseradish peroxidase—HRP) to generate high-density labeling of a target protein or nucleic acid sequence in situ. TSA has been reported to increase detection sensitivity up to 100-fold, as compared with conventional avidin-biotinylated enzyme complex (ABC) procedures. Moreover, for multiparameter detection of targets in either live or fixed cells or tissues, TSA can be combined with several other important technologies, including our nucleic acid labeling kits, primary and secondary antibodies, avidin and lectin conjugates, cytoskeletal stains, and others. According to preferred embodiments, TSA labeling is a combination of at least three elementary processes that typically comprise: a) binding of a probe to the target via immunoaffinity (proteins) or hybridization (nucleic acids) followed by secondary detection of the probe with an HRP-labeled antibody or streptavidin conjugate. Peroxidase conjugates of other targeting proteins such as lectins and receptor ligands are likely to be suitable for labeling targets, as is endogenous peroxidase activity; b) activation of multiple copies of a labeled tyramide derivative by HRP; often, a fluorescent or biotinylated tyramide is used; c) covalent coupling of the resulting highly reactive, short-lived tyramide radicals to residues (principally the phenol moiety of protein tyrosine residues) in the vicinity of the HRP-target interaction site, resulting in minimal diffusion-related loss of signal localization. Using a slide with a fluoro dot and a target dot in the context of a TSA assay may be particularly advantageous because the increased signal strength of the TSA assay is typically accompanied by a high variability of the signal amplification strength and thus with a large uncertainty regarding the actual amount of target contained in a tissue sample. Using a slide with a fluoro dot and a target dot in the context of a TSA assay may allow benefitting from the high sensitivity of the TSA protocol and at the same time being able to estimate the amount of target molecules in the sample.

Problems solved by technology

Therefore, the fluorescence intensity signal in fluorescence images does typically not allow an accurate determination of the number of biomarker molecules expressed in a cell and thus does not allow to accurately compare expression levels of two tissue samples having been stained in different staining procedures by means of fluorescence microscopy.
As the number of fluorophore molecules that bind to a particular tumor marker (i.e., a form of target protein) may depend on the temperature and duration of the staining step, on the chemical composition of the staining buffer and other factors, it is currently not possible to accurately quantify the effect of a particular anti-cancer drug on the expression level of a tumor marker, because other factors (related to the sample handling and preparation procedures, the staining protocol, the hardware of the microscope, etc.) have also a significant impact on the intensity of a fluorescence signal.
Although both methods tend to be complex, a growing number of semi-automated or automated systems exist which allow an accurate quantification of e.g. a particular protein in a particular cell or set of cells.
For example, the duration, temperature or solvent used during the staining process or while preparing a tissue sample for the staining protocol may have an impact on this ratio and may be an obstacle in determining the target molecule density based on the fluorescence signal intensity.
However, several factors limit the sensitivity and utility of these traditional enzymatic amplification procedures.
In particular, multilabeling options and sensitivity may be limited.
However, a downside of this amplification is that the degree of amplification depends on many parameters, e.g. parameters of the TSA Assay like temperature, staining duration, etc. and thus the strength of the fluorescence signal of a given number of target molecules may vary greatly in different TSA assays.

Method used


Image

  • Target molecule density determination in a fluorescence image
  • Target molecule density determination in a fluorescence image
  • Target molecule density determination in a fluorescence image

Examples


Embodiment Construction

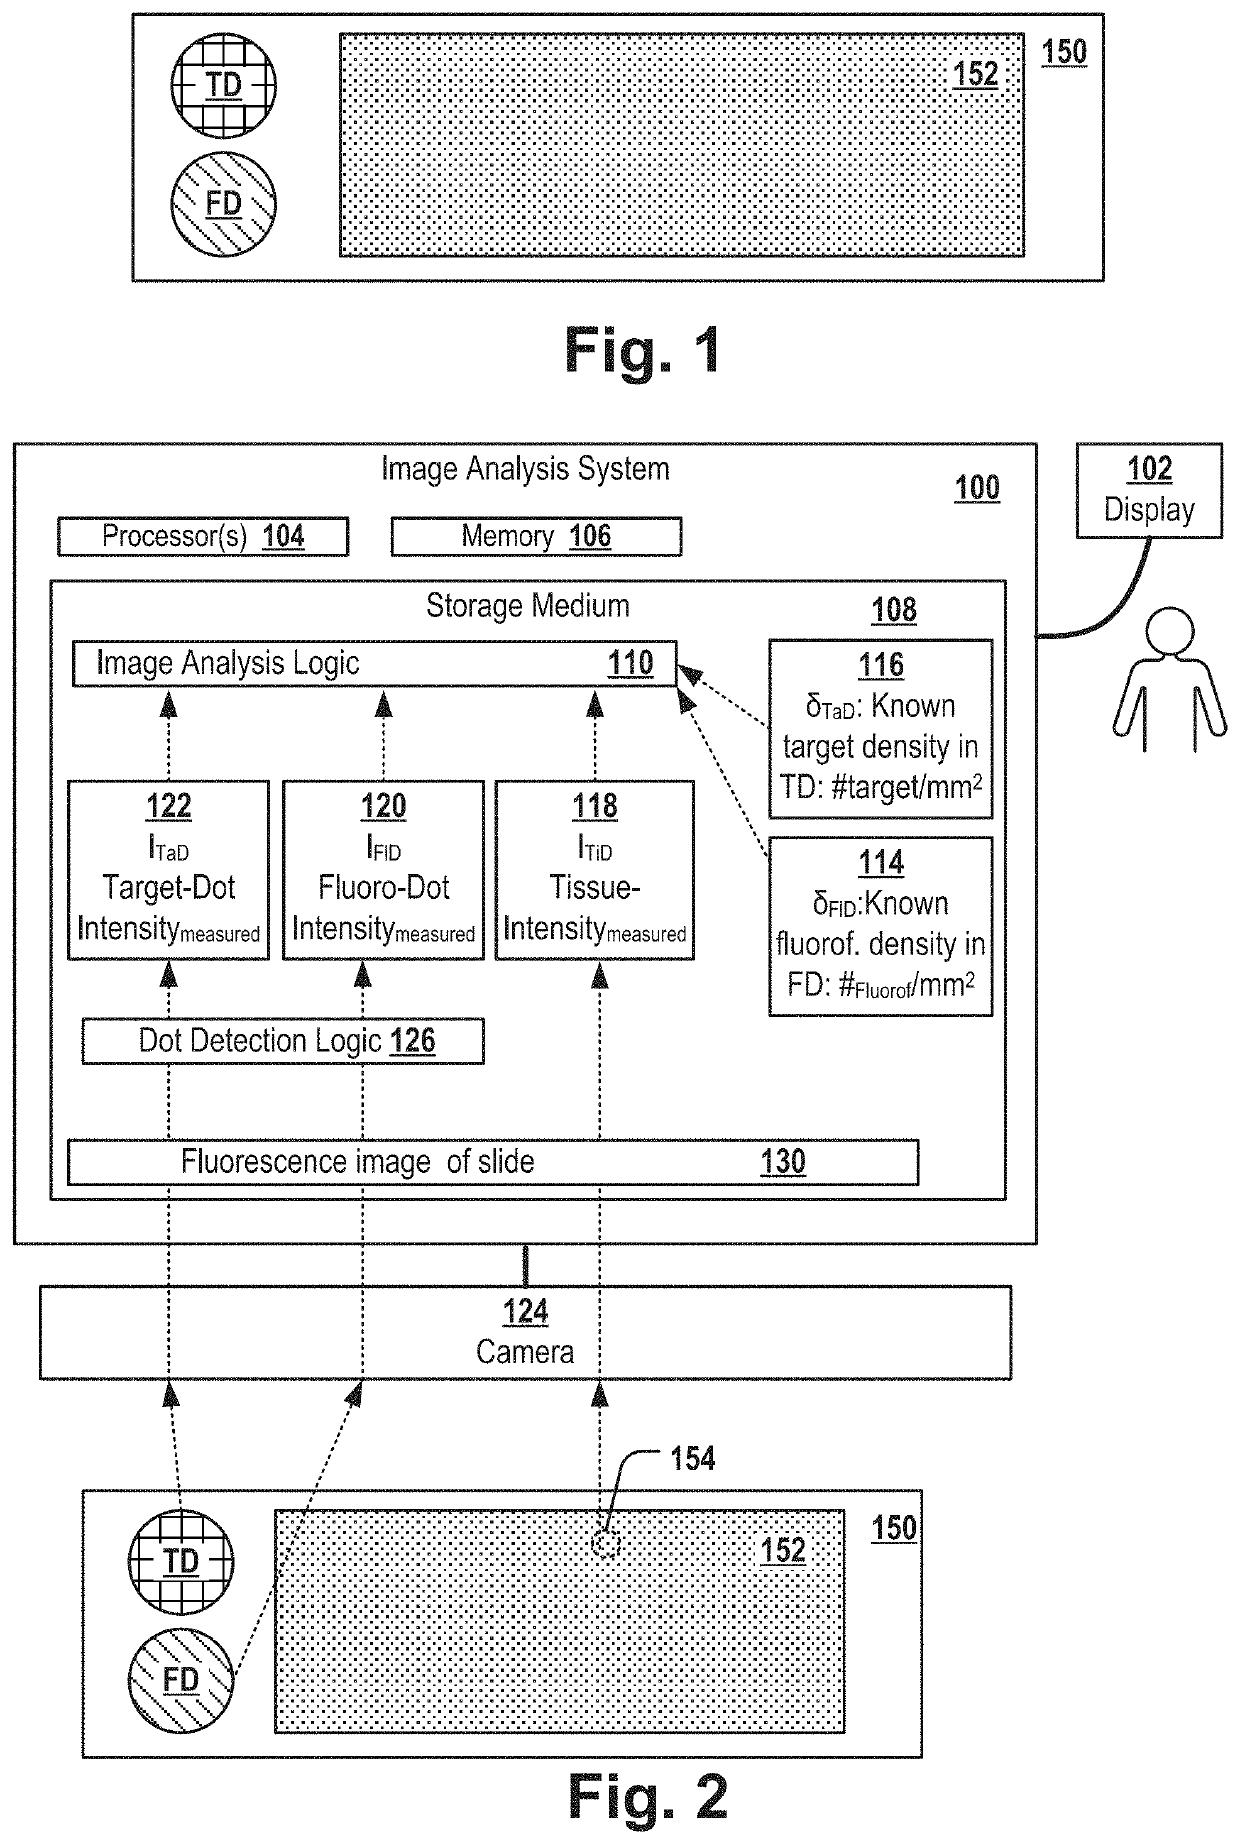
[0115]FIG. 1 shows a slide 150 that comprises a fluoro dot FD, a target dot TD and a tissue sample. The slide can be, for example, a glass tissue slide. In a first area FD referred herein as “fluoro dot”, the slide is covered by fluorescence-inducing molecules of a known molecule density. In a second area TD referred herein as “target dot”, the slide is covered by target molecules of a known molecule density. In a third area of the slide, the slide comprises a tissue sample 152, e.g. of a mammal, e.g. a tissue sample of tumor tissue of a patient.

[0116]Typically, the slide is used for examining the location of a particular type of molecule of interest, referred herein as “target molecule” and for determining the density (e.g. the “expression level” in case the target molecule is a protein) of the target molecules in the tissue sample. For example, the target molecules can be a biomarker for a particular tumor-subtype, e.g. Her2, BRCA1, BRCA2 or the like.

[0117]The target dot TD compri...


PUM

PropertyMeasurementUnit
radiusaaaaaaaaaa
radiusaaaaaaaaaa
sizeaaaaaaaaaa

Abstract

The method includes receiving a digital image of a slide, the slide including the tissue sample, a target dot and a fluoro dot. The digital image includes intensity values of the tissue sample, the target dot and the fluoro dot. The method further includes receiving pixel intensities of the fluoro dot depicted in the image; pixel intensities of the target dot depicted in the image; pixel intensities of an area of the tissue sample depicted in the image; fluorescence-inducing molecule density information indicative of the known density of the fluorescence-inducing molecules in the fluoro dot; target molecule density information indicative of the known density of the target molecules in the target dot; and computing the density of target molecules in the area of the tissue sample as a function of the received pixel intensities and the received molecule density information.

Description

CROSS-REFERENCE TO RELATED APPLICATIONS[0001]This application is a national phase under 35 U.S.C. § 371 of PCT International Application No. PCT / EP2018 / 059528 which has an International filing date of Apr. 13, 2018, which claims priority to European patent application number EP 17166661.3 filed Apr. 13, 2017.FIELD OF THE INVENTION[0002]The invention relates to the field of image analysis, and more particularly to the field of fluorescence image-based quantification of target molecules.BACKGROUND AND RELATED ART[0003]Fluorescence microscopes are commonly used for studying particular cells which have been labeled with fluorescence-labeled antibodies or other fluorescence labeled proteins in order to detect the occurrence and, at least roughly, the quantity of a particular molecule of interest. For example, fluorescence microscope images are often generated and analyzed in order to determine if and to what amount a particular biomarker (being an indicator of a physiological state, e.g....

Claims


Application Information

Patent Timeline
Patent Type & Authority Patents(United States)
IPC IPC(8): G06K9/00G01N21/64G01N33/50G06T7/00
CPCG01N21/6458G01N21/6486G01N33/5005G06T7/0012G01N21/6456
Inventor KLAIMAN, ELDAD
Owner F HOFFMANN LA ROCHE & CO AG
Why Eureka
Eureka Blog
Learn More