Eureka AIR delivers breakthrough ideas for toughest innovation challenges, trusted by R&D personnel around the world.

Target molecule density determination in a fluorescence image

a fluorescence image and target molecule technology, applied in the field of image analysis, can solve the problems of inability to accurately compare expression levels, inability to accurately quantify the effect of a particular anti-, and both methods tend to be complex, so as to improve the accuracy of detection and detection, computationally eliminate the impact of parameters, and normalize acquired intensity information

Active Publication Date: 2020-01-30
F HOFFMANN LA ROCHE & CO AG
View PDF0 Cites 4 Cited by
  • Summary
  • Abstract
  • Description
  • Claims
  • Application Information

AI Technical Summary

Benefits of technology

The invention relates to a new slide design for use in a technique called fluorescence image analysis. The slide has a fluoro dot and a target dot, which can be used to calibrate the intensity of the fluorescence image. This allows for accurate and precise determination of the number of target molecules in a tissue sample. The invention also describes a staining method called TSA (tyramide signal amplification) that utilizes enzyme-mediated detection to increase sensitivity and improve detection of targets in live or fixed cells or tissues. This staining method can be combined with other important techniques such as nucleic acid labeling, antibodies, and lectin conjugates. The use of a slide with a fluoro dot and target dot in the context of TSA may further benefit from the increased sensitivity of the TSA protocol and allow for the estimation of the amount of target molecules in a sample.

Problems solved by technology

Therefore, the fluorescence intensity signal in fluorescence images does typically not allow an accurate determination of the number of biomarker molecules expressed in a cell and thus does not allow to accurately compare expression levels of two tissue samples having been stained in different staining procedures by means of fluorescence microscopy.
As the number of fluorophore molecules that bind to a particular tumor marker (i.e., a form of target protein) may depend on the temperature and duration of the staining step, on the chemical composition of the staining buffer and other factors, it is currently not possible to accurately quantify the effect of a particular anti-cancer drug on the expression level of a tumor marker, because other factors (related to the sample handling and preparation procedures, the staining protocol, the hardware of the microscope, etc.) have also a significant impact on the intensity of a fluorescence signal.
Although both methods tend to be complex, a growing number of semi-automated or automated systems exist which allow an accurate quantification of e.g. a particular protein in a particular cell or set of cells.
For example, the duration, temperature or solvent used during the staining process or while preparing a tissue sample for the staining protocol may have an impact on this ratio and may be an obstacle in determining the target molecule density based on the fluorescence signal intensity.
However, several factors limit the sensitivity and utility of these traditional enzymatic amplification procedures.
In particular, multilabeling options and sensitivity may be limited.
However, a downside of this amplification is that the degree of amplification depends on many parameters, e.g. parameters of the TSA Assay like temperature, staining duration, etc. and thus the strength of the fluorescence signal of a given number of target molecules may vary greatly in different TSA assays.

Method used


Image

  • Target molecule density determination in a fluorescence image
  • Target molecule density determination in a fluorescence image
  • Target molecule density determination in a fluorescence image

Examples


Embodiment Construction

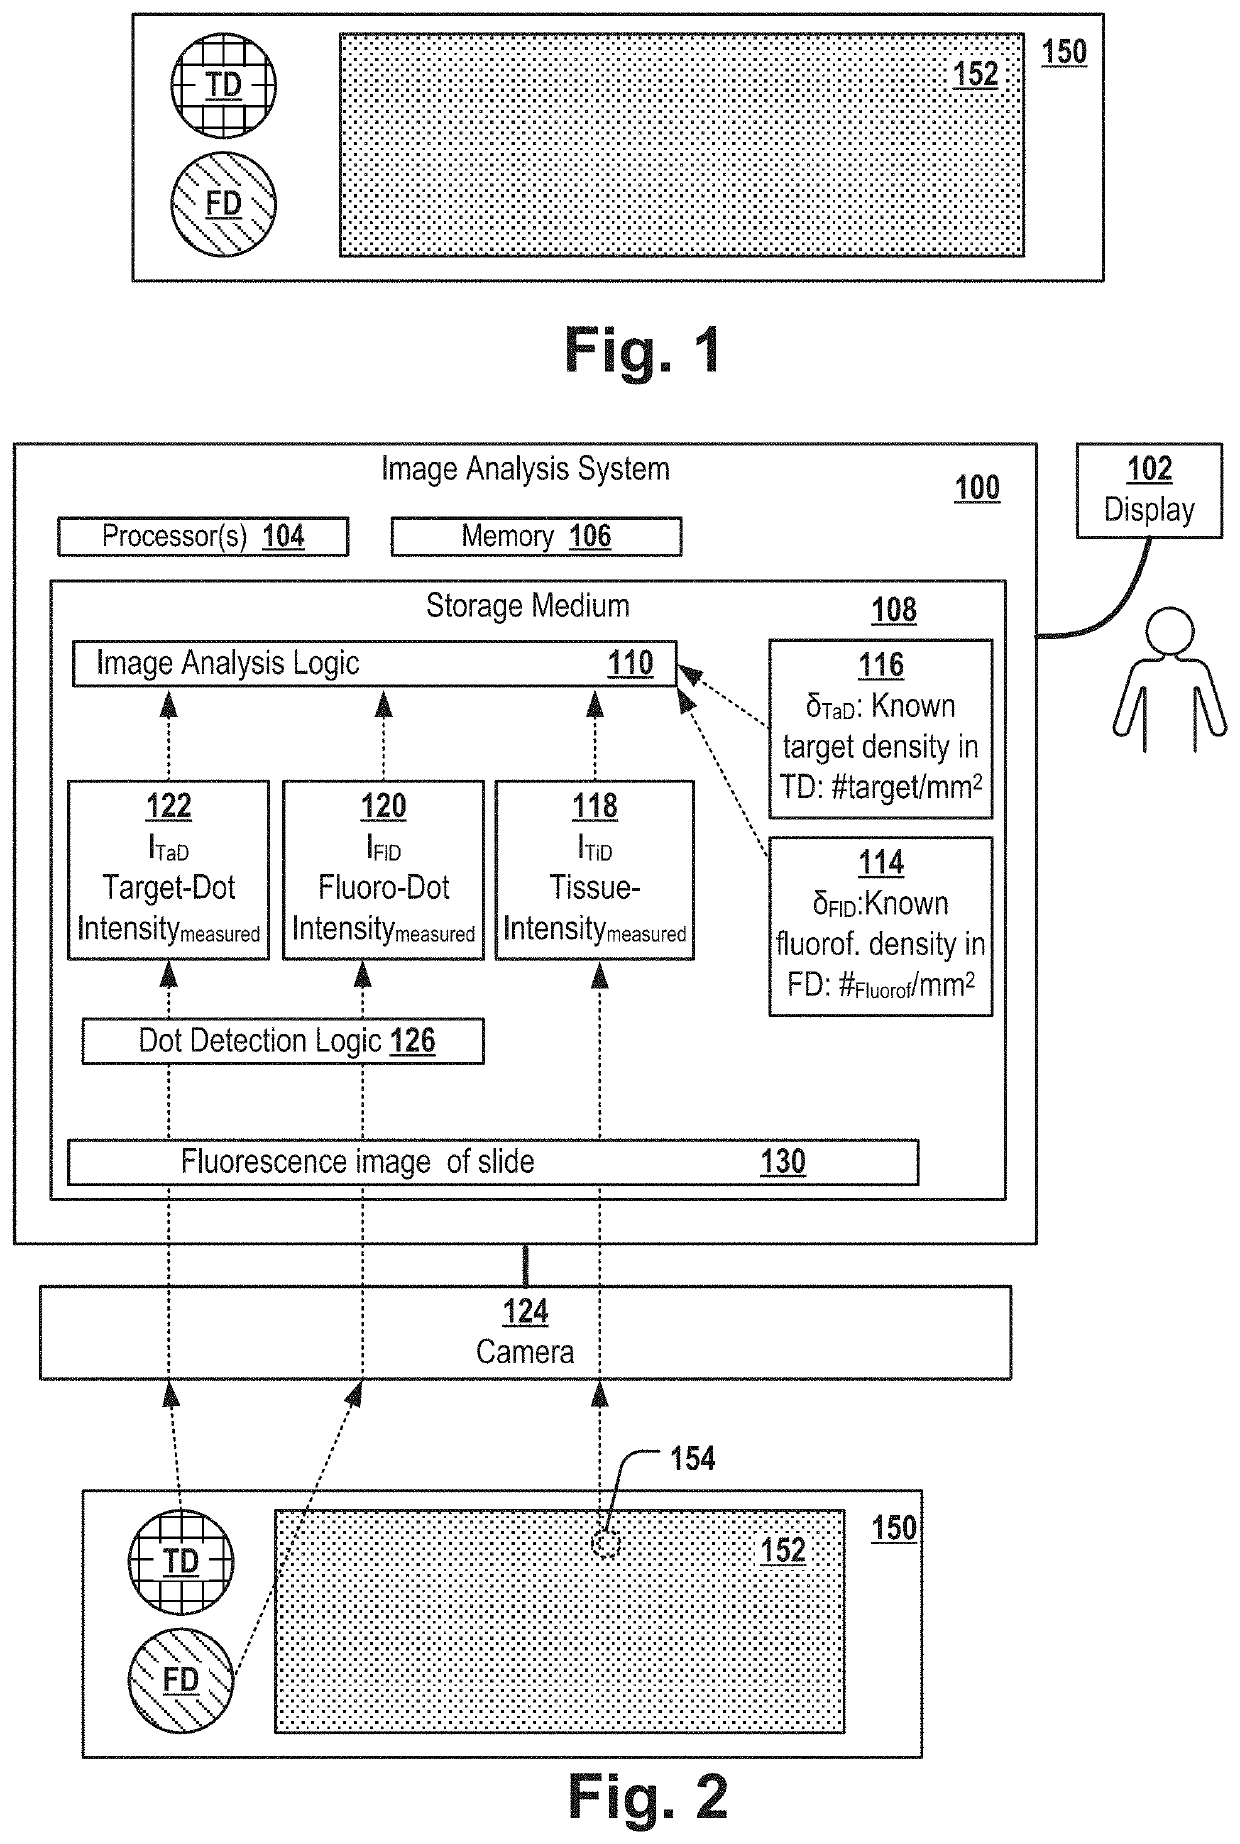
[0110]FIG. 1 shows a slide 150 that comprises a fluoro dot FD, a target dot TD and a tissue sample. The slide can be, for example, a glass tissue slide. In a first area FD referred herein as “fluoro dot”, the slide is covered by fluorescence-inducing molecules of a known molecule density. In a second area TD referred herein as “target dot”, the slide is covered by target molecules of a known molecule density. In a third area of the slide, the slide comprises a tissue sample 152, e.g. of a mammal, e.g. a tissue sample of tumor tissue of a patient.

[0111]Typically, the slide is used for examining the location of a particular type of molecule of interest, referred herein as “target molecule” and for determining the density (e.g. the “expression level” in case the target molecule is a protein) of the target molecules in the tissue sample. For example, the target molecules can be a biomarker for a particular tumor-subtype, e.g. Her2, BRCA1, BRCA2 or the like.

[0112]The target dot TD compri...


PUM

PropertyMeasurementUnit
radiusaaaaaaaaaa
radiusaaaaaaaaaa
sizeaaaaaaaaaa

Abstract

The method includes receiving a digital image of a slide, the slide including the tissue sample, a target dot and a fluoro dot. The digital image includes intensity values of the tissue sample, the target dot and the fluoro dot. The method further includes receiving pixel intensities of the fluoro dot depicted in the image; pixel intensities of the target dot depicted in the image; pixel intensities of an area of the tissue sample depicted in the image; fluorescence-inducing molecule density information indicative of the known density of the fluorescence-inducing molecules in the fluoro dot; target molecule density information indicative of the known density of the target molecules in the target dot; and computing the density of target molecules in the area of the tissue sample as a function of the received pixel intensities and the received molecule density information.

Description

FIELD OF THE INVENTION[0001]The invention relates to the field of image analysis, and more particularly to the field of fluorescence image-based quantification of target molecules.BACKGROUND AND RELATED ART[0002]Fluorescence microscopes are commonly used for studying particular cells which have been labeled with fluorescence-labeled antibodies or other fluorescence labeled proteins in order to detect the occurrence and, at least roughly, the quantity of a particular molecule of interest. For example, fluorescence microscope images are often generated and analyzed in order to determine if and to what amount a particular biomarker (being an indicator of a physiological state, e.g. a disease, in particular a cancer or cancer sub-type) is present in a cell.[0003]Typically, fluorescence intensity and biomarker expression are positively correlated and the intensity of a fluorescence signal is used as an indicator for the amount of the biomarker.[0004]However, due to various instrumental f...

Claims


Application Information

Patent Timeline
Patent Type & Authority Applications(United States)
IPC IPC(8): G01N21/64G06T7/00G01N33/50
CPCG01N21/6486G01N21/6458G01N33/5005G06T7/0012G01N21/6456
Inventor KLAIMAN, ELDAD
Owner F HOFFMANN LA ROCHE & CO AG
Why Eureka
Eureka Blog
Learn More