

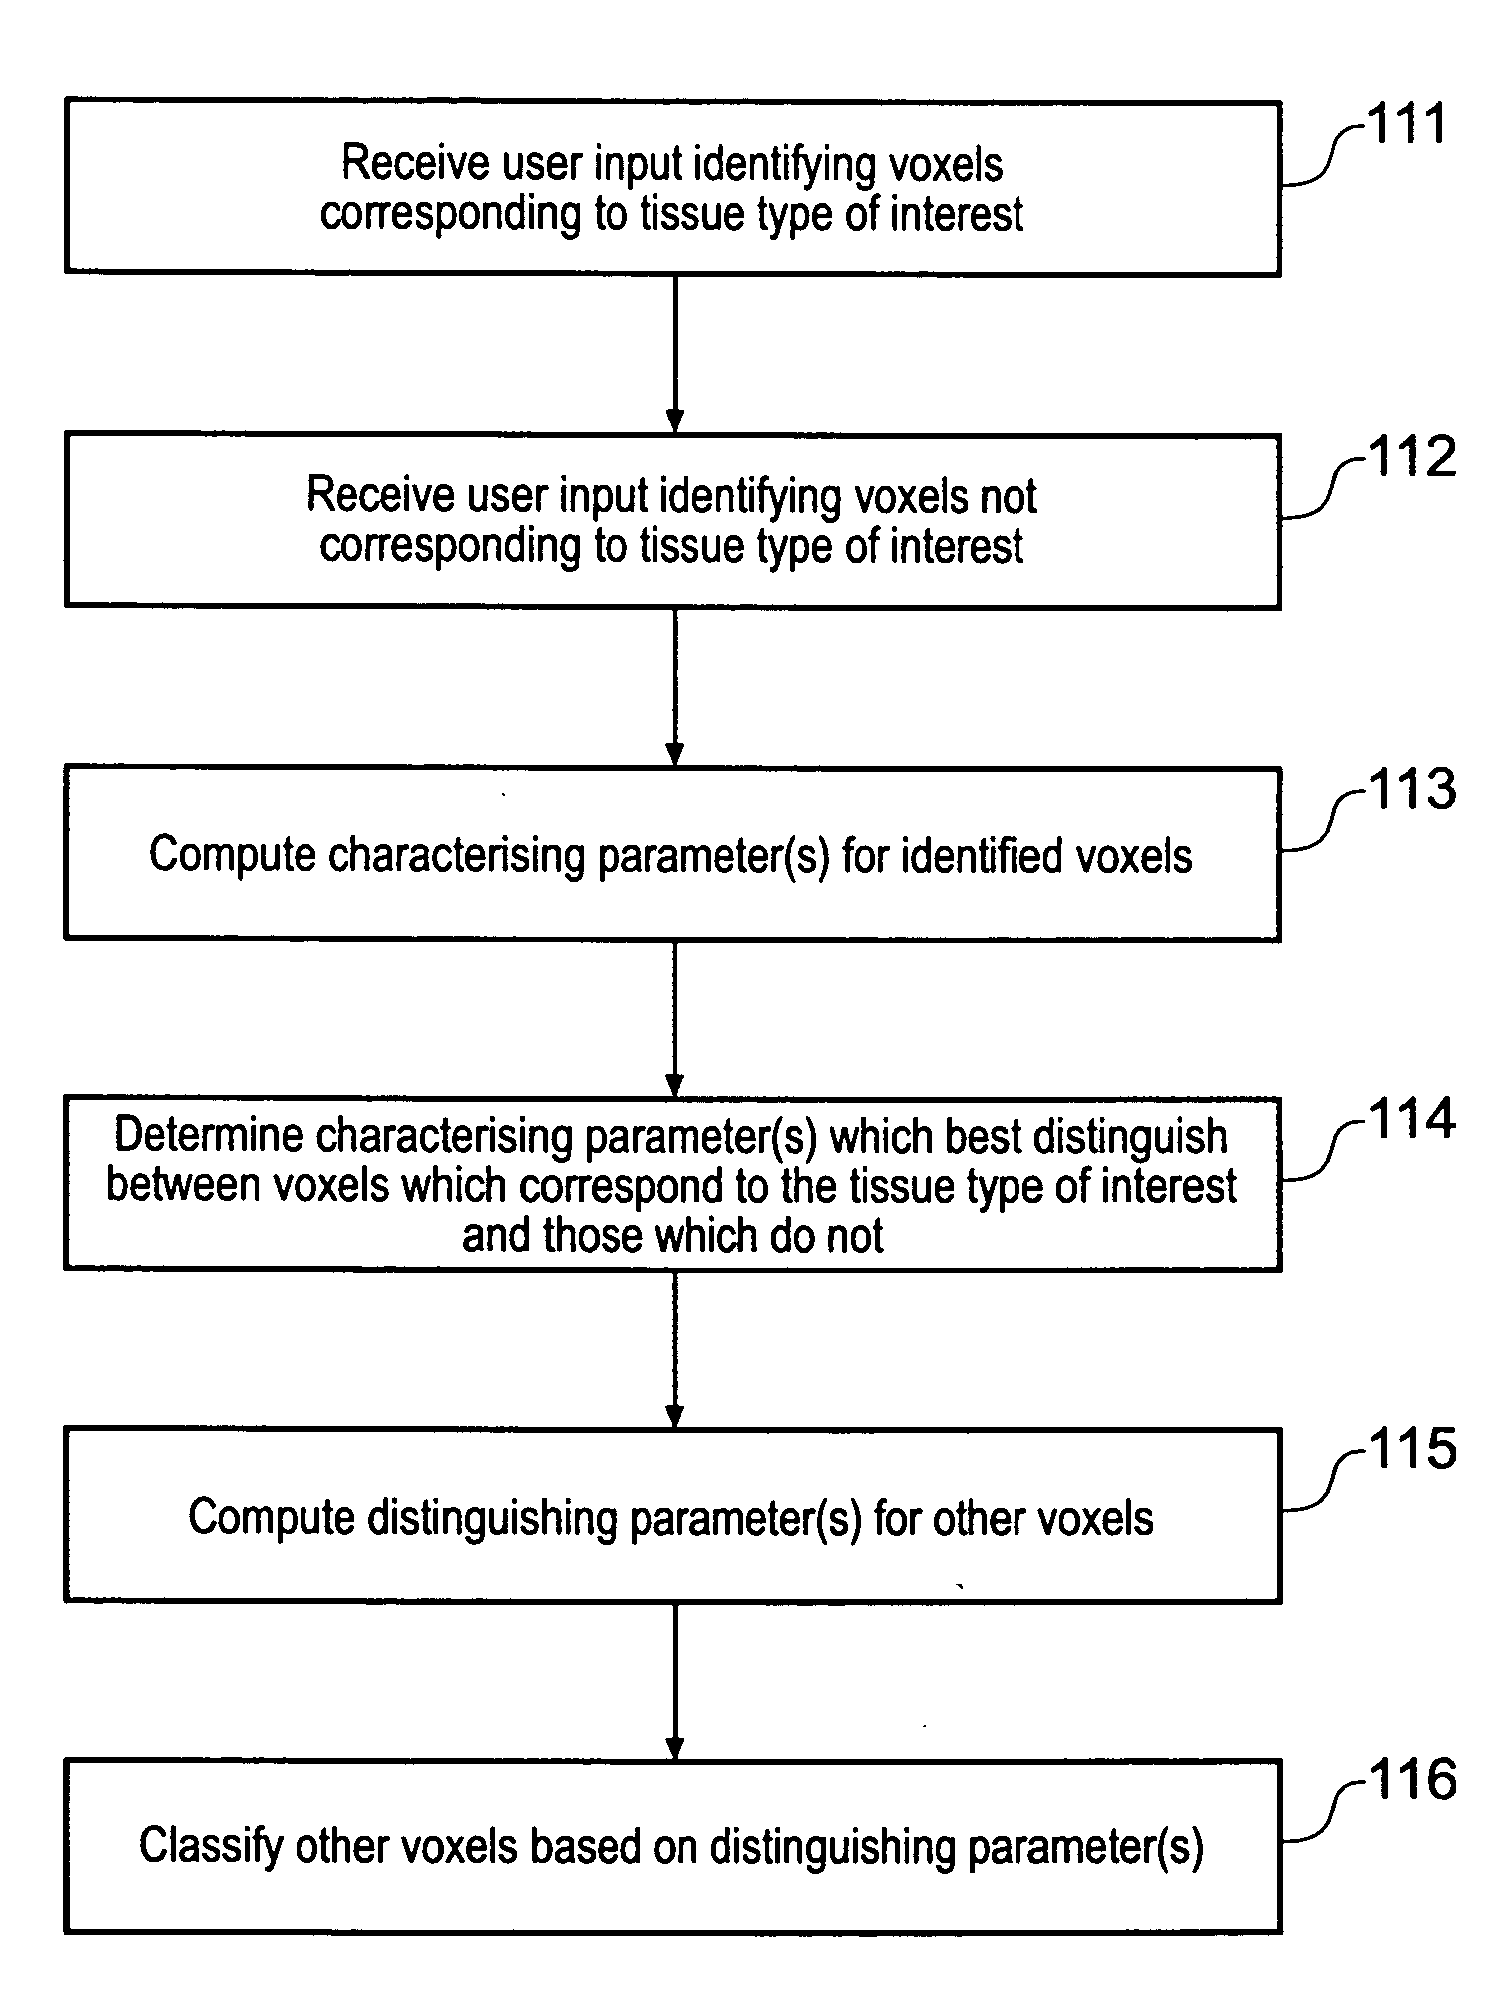
Displaying image data using automatic presets
a technology of image data and presets, applied in image data processing, sensors, diagnostics, etc., can solve the problems of not being able to compare and interpret images created by different users, not being able to accurately represent images created by single users, and not being able to accurately represent colors chosen for application to one particular projected imag
- Summary
- Abstract
- Description
- Claims
- Application Information
AI Technical Summary
Benefits of technology
Problems solved by technology
Method used
Image

Examples
first example
Active MR Preset
[0101] Magnetic resonance imaging (MR) data sets are generally un-calibrated and display a wide range of data-values, dependent on, for example, acquisition parameter values or the position of the VOI with respect to a scanner's detector coils during scanning. Accordingly, it is not usually possible to pre-estimate suitable signal values with which to attribute color range presets and this makes the present invention especially useful for application to MR data sets.
[0102]FIG. 7a schematically shows the appearance of a visualization state tool displayed on the display 144 shown in FIG. 6. The display tool shows a user the outcome of a preset determination method for a selected VOI. The visualization state tool comprises a data display window 80, a color display bar 72, a display of opacity values 74, a display of boundary positions 78, a display of sharpness values 76 and a number of display modification buttons 82. The color display bar identifies the five color r...
second example
Active CT Preset
[0110] In this example, the same preset type is used as in the first example. This may be useful for CT data sets in which a user wants to visualize soft tissue.
third example
Active Bone (CT) Preset
[0111] This example is for use on CT data sets for the purpose of visualizing and selecting bone.
[0112]FIG. 8a schematically shows the appearance of a visualization state tool presenting an example of use of the “Active Bone (CT)” Preset. The different fields within the visualization state tool shown in FIG. 8a will be understood from the description of FIG. 7a.
[0113] The “Active Bone (CT) Preset” operates by determining a first significant visualization threshold within the signal value range 70 HU to 270 HU. In the example, a visualization threshold value of 182 HU is determined. If no such visualization threshold is found then 170 HU is used. This first visualization threshold is used to set the background level in the display software by setting two boundary positions at ±45 HU from the first visualization threshold. The boundary positions in this example are accordingly at 137 HU and 227 HU. With the five available ranges of color indicated in FIG. 8a ...
PUM
 Abstract
Description
Claims
Application Information