Apparatus and method for determining thermal neutron capture cross section of a subsurface formation from a borehole using multiple detectors

Inactive Publication Date: 2005-03-31
BAKER HUGHES INC
12 Cites 38 Cited by

AI-Extracted Technical Summary

Problems solved by technology

Under certain wellbore conditions, it is difficult to determine the fractional saturation of oil or gas by processing the capture gamma ray meas...

Method used

Combined pulsed neutron capture data from multiple detectors can be used in such a way as to improve the statistical precision and the accuracy of the measurement. The term “precision” refers, in a general sense, to the repeatability of the measurements, i.e., a more precise sensing device will give the same value for repeated measurements of the same parameter. The term “accuracy” refers to how close the output of a sensing device is to the true value of the quantity being measured. Thus, a precise measurement that has a bias is not an accurate measurement.
In a preferred embodiment of the invention, a weighted combination of data from two or more detectors is used to provide measurements with statistical precision superior to any one of the individual detectors alone. Such combinations will have measurement characteristics that are somewhat different from those of any individual detector alone. As discussed above, the XLS detector 107 achieves a higher degree of accuracy over the measured interval than measurements of the LS 105 and SS 106 detector. The XLS 107 detector will also have a lower resolution and lower precision than the LS and SS detectors. In the present invention, a measurement is obtained with an accuracy of a measurement from the XLS detector and a precision obtained from a weighted normalized Σcomb. This can be done in the manner described next.
In a second, preferred embodiment of the invention, a sequence of steps similar to that outlined in FIG. 3 is carried out with one difference: the first set of measurements include both the SS and LS measurements. In this manner, a more precise and more accurate measurement with reasonably high resolution is obtained.
In the present invention described above with reference to FIG. 1, the SS detector 105 measures the received signals at a high level of precision. As the source-detector spacing increases, this level of precision drops, so that measurements at LS detector 106 are not as precise as the measurements from the SS detector. On the other hand, measurements obtained at the SS detector are highly perturbed by interaction with elements within the borehole. Increasing the spacing between source and detector reduces the perturbative effects of the borehole, thereby increasing the accuracy of the measurement at the XLS detector 107. The logging tool described above may be part of a system, such as that illustrated in FIG. 2. The system shown in FIG. 2 is a prior art system. Well 10 penetrates the earth's surface and may or may not be cased depending upon the particular well being investigated. Disposed within well 10 is subsurface well logging instrument 12. The system diagramed in FIG. 2 is a micr...

Benefits of technology

The present invention is a method and apparatus for determining a parameter of interest of an earth formation with a logging tool having a source for irradiating said earth formation and a plurality of detectors spaced apart from the source for making measurements resulting from interaction of the radiation with the earth formation. The parameter of interest may be a density or porosity of the earth formation. In one embodiment of the invention, a first and second set of measurements are made with first and second detectors. The first detector has a higher precision, higher resolution, and lower accuracy than the second detector. The measurements of the first and second detectors are combined to give measurements with improved accuracy and precision. The combi...

Abstract

A well logging instrument including a plurality of detectors having different precisions and accuracies, the more precise detectors generally having lower accuracies. The detectors are responsive the interaction of an radiation from a suitable source on the instrument with earth formations. Outputs from the plurality of detectors are smoothed and combined to provide processed measurements with improved accuracy and precision.

Application Domain

Technology Topic

Thermal neutron captureAccuracy and precision +4

Image

  • Apparatus and method for determining thermal neutron capture cross section of a subsurface formation from a borehole using multiple detectors
  • Apparatus and method for determining thermal neutron capture cross section of a subsurface formation from a borehole using multiple detectors
  • Apparatus and method for determining thermal neutron capture cross section of a subsurface formation from a borehole using multiple detectors

Examples

  • Experimental program(1)

Example

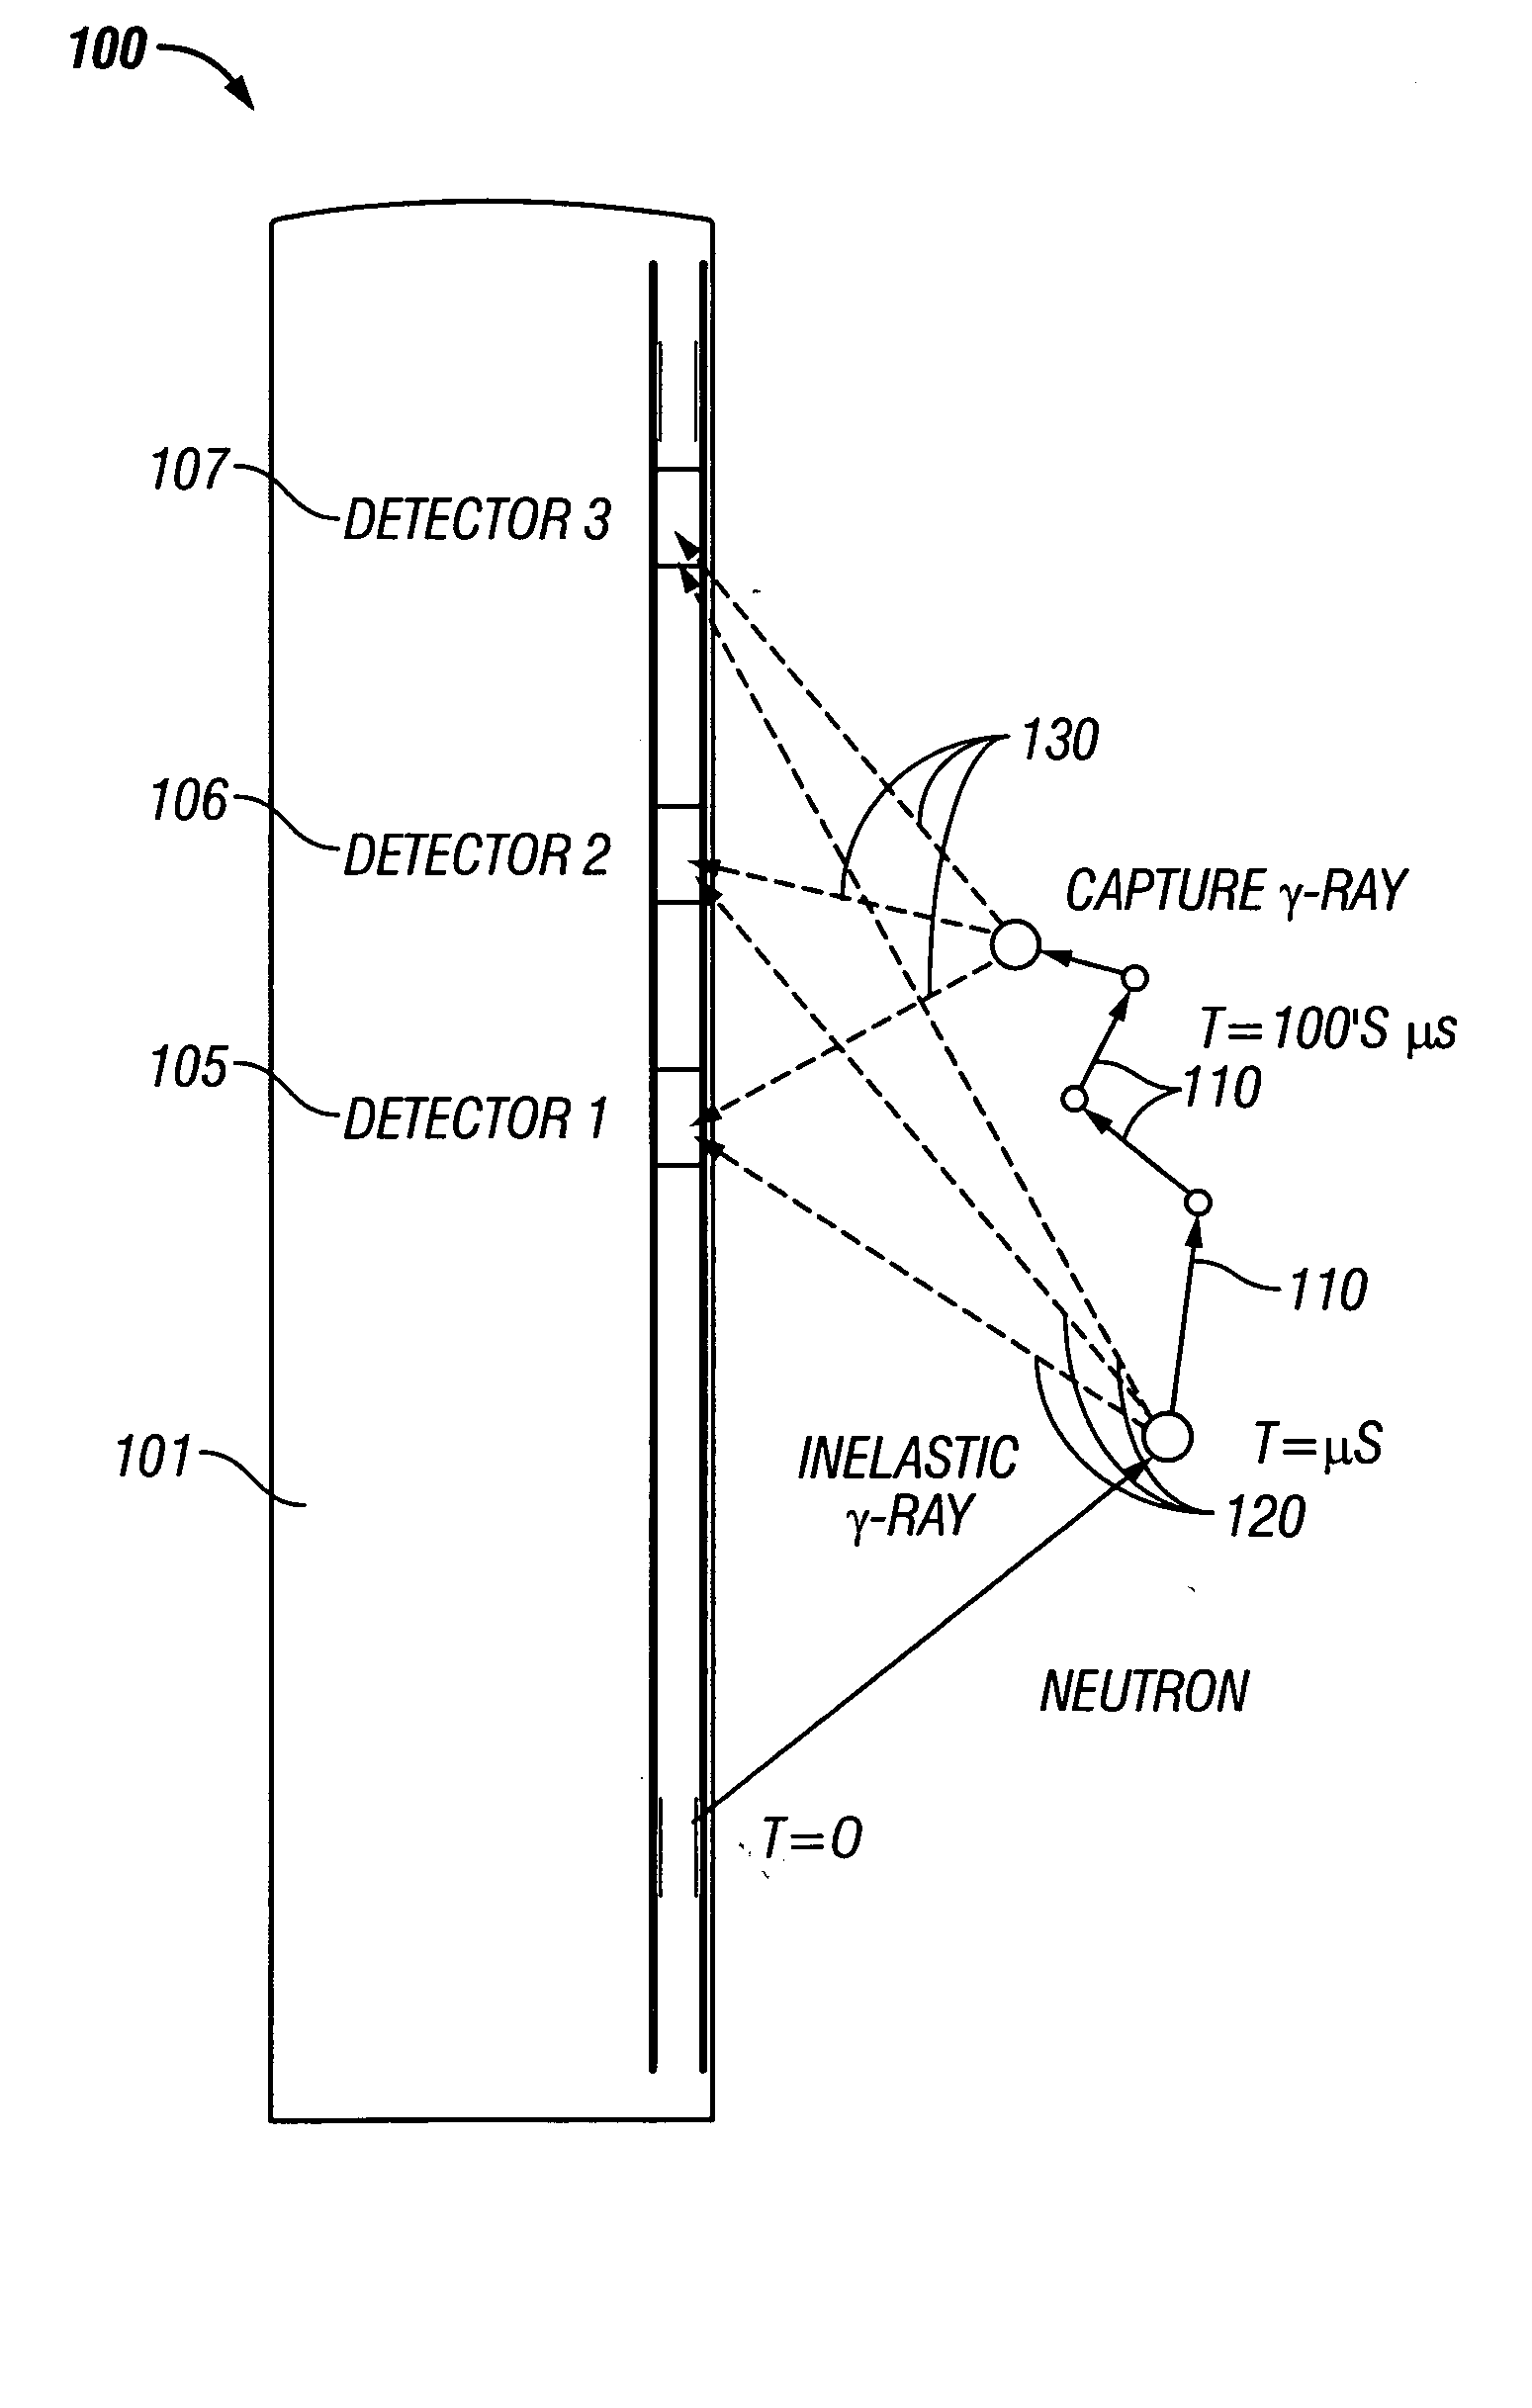
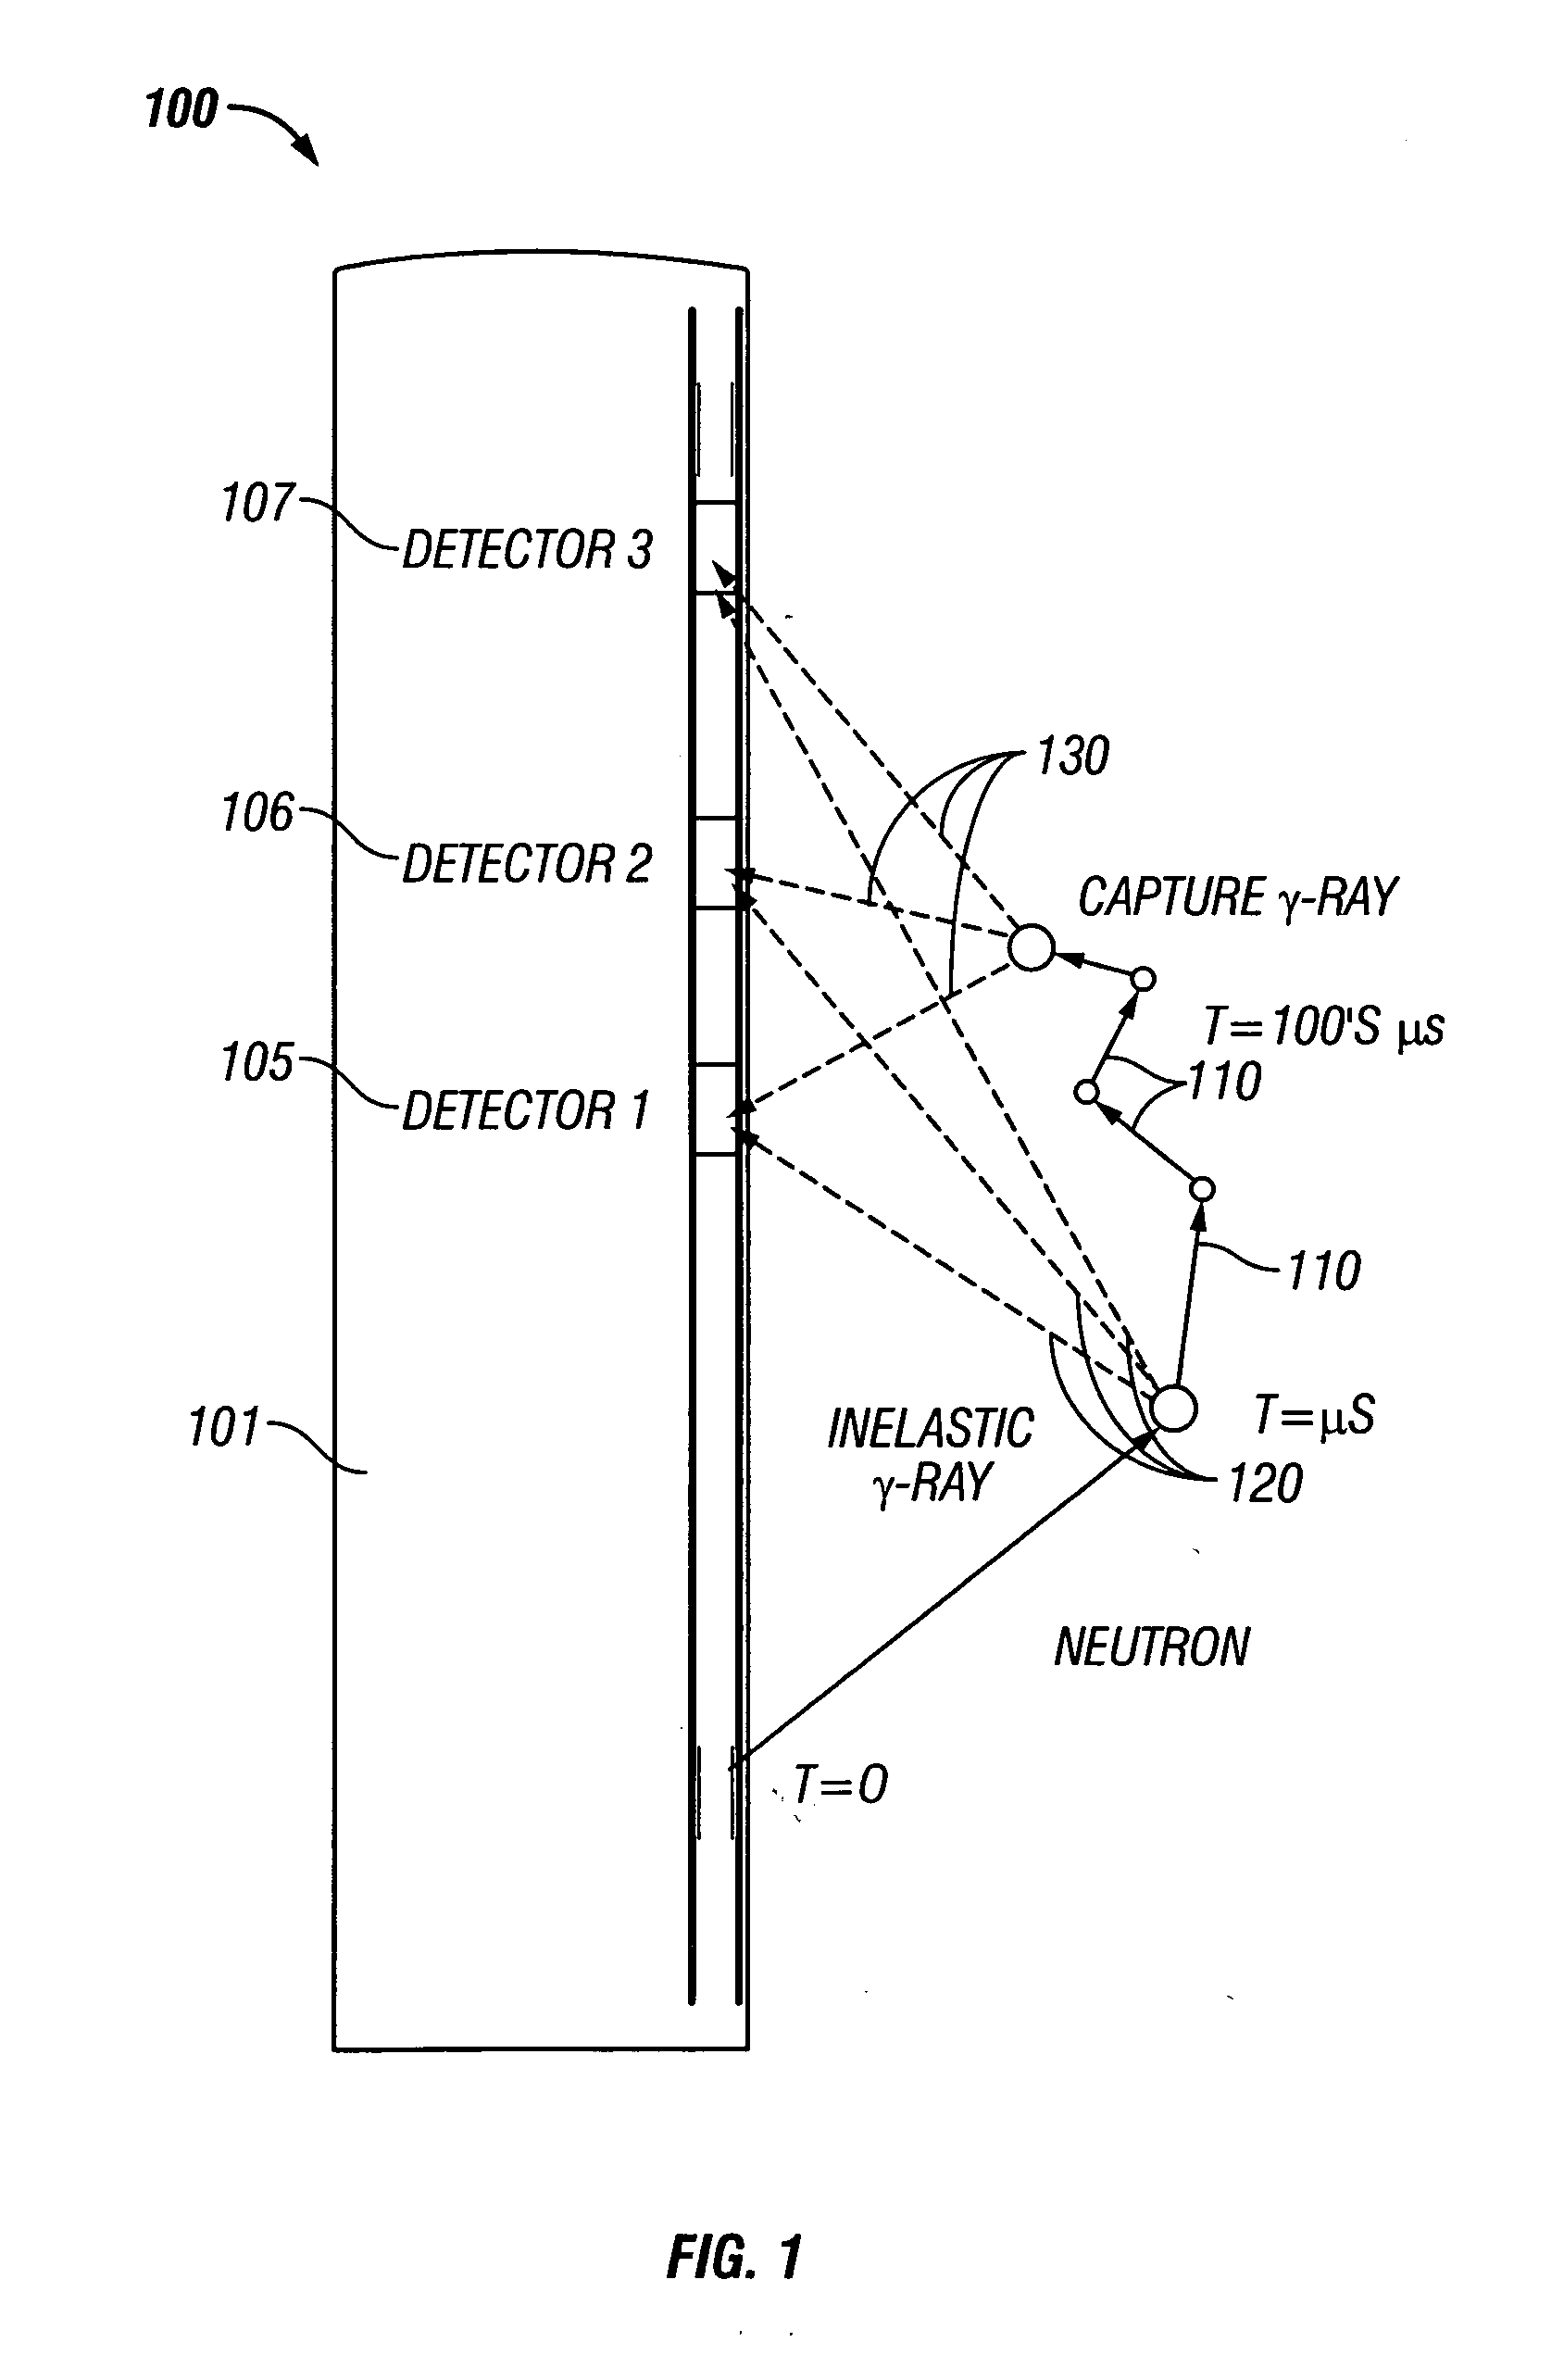
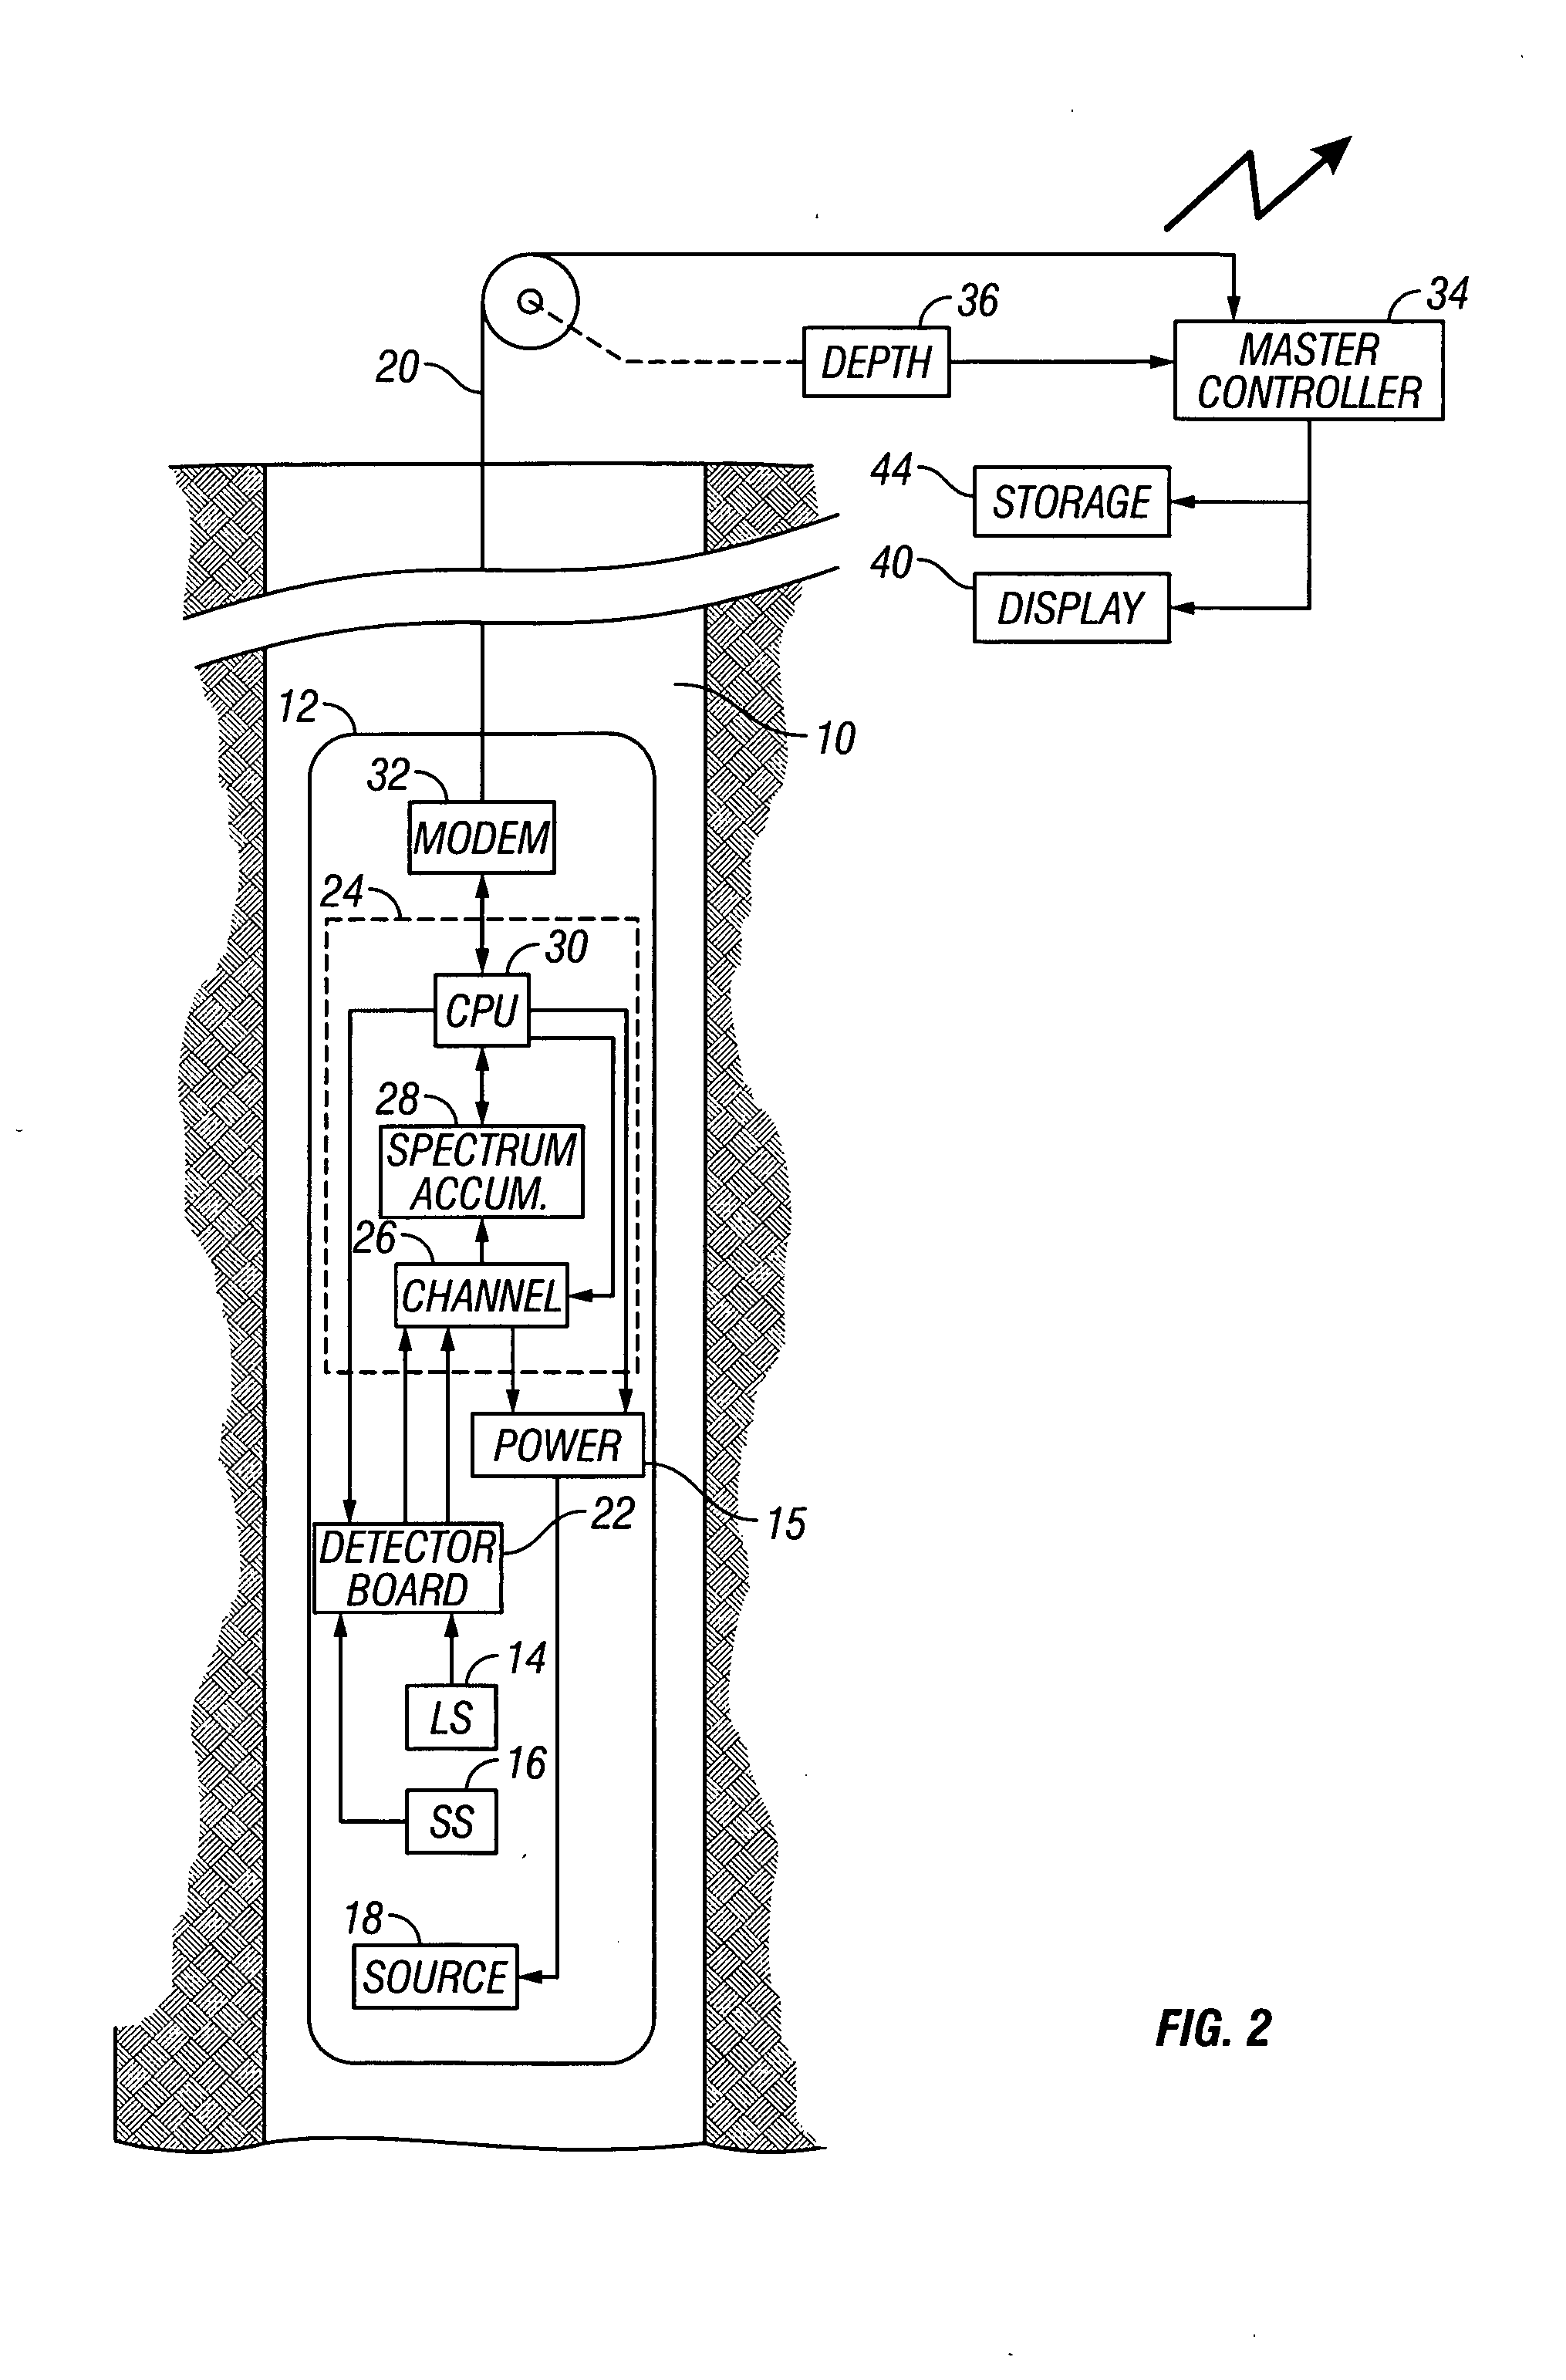
FIG. 1 shows an illustration of an apparatus suitable for use with the present invention. The apparatus illustrated is that of the Reservoir Performance Monitor (RPM) of Baker Atlas, Incorporated. A measurement device 100 comprises a neutron source 101 and three axially spaced apart detectors described below. The number of detectors shown in the embodiment of FIG. 1 is only example of the number of detectors employed in an embodiment of the present invention. It is not a limitation on the scope of the present invention. The measurement device of the present invention may comprise two or more detectors. The neutron source 101 may be pulsed at different frequencies and modes for different types of measurements. Detector short-spaced (SS) detector 105 is closest to the source 101 The long-spaced (LS) detector is denoted by 106, and the furthest detector 107 is referred to as the extra-large spaced (XLS) detector. Fast neutrons (approximately 14 MeV) are emitted from the source 101 and enter the borehole and formation, where they undergo several types of interactions. During the first few microseconds (μs), before they lose much energy, some neutrons are involved in inelastic scattering with nuclei in the borehole formation and produce gamma rays. These inelastic gamma rays 120, have energies that are characteristic of the atomic nuclei that produced them. The atomic nuclei found in this environment include, for example, carbon, oxygen, silicon, calcium, and some others.
Two or more gamma-ray detectors are employed, in one or more modes of operation. Such modes include, but are not limited to, a pulsed neutron capture mode, a pulsed neutron spectrometry mode, a pulsed neutron holdup imager mode, and a neutron activation mode. In a pulsed neutron capture mode, for example, the tool pulses at 1 kHz, and records a complete time spectrum for each detector. An energy spectrum is also recorded for maintaining energy discrimination levels. Time spectra from short-spaced and long-spaced detectors can be processed individually to provide traditional thermal neutron capture cross section information, or the two spectra can be used together to automatically correct for borehole and diffusion effects and produce results substantially approximating intrinsic formation values.
In a pulsed neutron spectrometry mode, the instrument pulses at 10 kHz, for example, and records full inelastic and capture gamma ray energy spectra from each detector. These data are processed to determine critical elemental ratios including carbon/oxygen and calcium/silicon from the inelastic spectra and silicon/calcium from the capture spectra. A pulsed neutron holdup imager mode yields both energy spectra and time decay spectra from each detector simultaneously. Measurements can be used to determine holdups of gas, oil, and water. When combined with other production logs, the measurements made herein can provide a comprehensive production profile picture, even in deviated or horizontal wells. A neutron activation mode provides water-flow measurements using one of several data acquisition methods. Stationary measurements are made in either of two modes, and measurements at different logging speeds can be used to segregate different flow rates in either an annulus or in an adjacent tubing string. Various spectra of count rates from these can be used either individually or in combination as needed for each measurement mode.
With the neutron generator turned off, the measurement apparatus can also be used to detect the distribution of materials, tagged with radioactive tracers, that are injected into the well during well treatments. In this manner, the effectiveness of operations such as hydraulic fracturing or gravel pack placement can be evaluated.
In an embodiment of the present invention, a pulsed neutron generator with improved reliability and higher output is coupled with high-speed downhole microprocessor-controlled drivers and detector electronics. The system supports multiple frequency operation and different detection gate timings to make the different measurements. The modes of operation can be selected from the surface with no need to pull the tool out of the well.
After just a few μs, most of the neutrons are slowed by either inelastic or elastic scattering until they reach thermal energies, about 0.025 eV. This process is illustrated schematically in FIG. 1 as the sequence of solid arrows 110. At thermal energies, neutrons continue to undergo elastic collisions, but they no longer lose energy on average. A few μs after the neutron generator shuts off, this process is complete. Over the next several hundred μs, thermal neutrons are captured by nuclei of various elements—again producing gammas rays, known as capture gamma rays 130. A capture gamma ray energy spectrum yields information about the relative abundances of these elements.
The rate at which the thermal neutron population is captured can be determined from the total number of capture gamma rays recorded as a function of time. This time decay spectrum can provide information about those elements with large cross sections for (or high probabilities of) thermal neutron capture.
Typically, the precision and accuracy of a given detector are dependent on the distance from the detector to the source. At shorter distances, a significant number of received signals are attributable to material residing in the borehole region, rather than in the earth formation being investigated. The accuracy of such a measurement at short source-detector distances is thereby reduced. On the other hand, close proximity of a detector to a source results in a high signal strength. This high signal strength leads to a high degree of statistical precision of the measurement taken at that short distance. At longer distances between detector and source, an increased percentage of signals are obtained from the earth formation, thereby leading to a higher degree of accuracy of the measurement obtained. However, the number of signals obtained by the detector is significantly reduced due to the increased distance and diffusion processes. Lack of sufficient signal strength yields a lower statistical precision of the measurement.
In the present invention described above with reference to FIG. 1, the SS detector 105 measures the received signals at a high level of precision. As the source-detector spacing increases, this level of precision drops, so that measurements at LS detector 106 are not as precise as the measurements from the SS detector. On the other hand, measurements obtained at the SS detector are highly perturbed by interaction with elements within the borehole. Increasing the spacing between source and detector reduces the perturbative effects of the borehole, thereby increasing the accuracy of the measurement at the XLS detector 107. The logging tool described above may be part of a system, such as that illustrated in FIG. 2. The system shown in FIG. 2 is a prior art system. Well 10 penetrates the earth's surface and may or may not be cased depending upon the particular well being investigated. Disposed within well 10 is subsurface well logging instrument 12. The system diagramed in FIG. 2 is a microprocessor-based nuclear well logging system using multi-channel scale analysis for determining the timing distributions of the detected gamma rays. Well logging instrument 12 includes long-spaced (LS) detector 14, short-spaced (SS) detector 16 and pulses neutron source 18. In one embodiment, LS and SS detectors 14 and 16 are comprised of bismuth-germanate (BGO) crystals coupled to photomultiplier tubes. To protect the detector systems from the high temperatures encountered in boreholes, the detector system may be mounted in a Dewar-type flask. Also, in the preferred embodiment, source 18 comprises a pulsed neutron source using a D-T reaction wherein deuterium ions are accelerated into a tritium target, thereby generating neutrons having an energy of approximately 14 MeV. The filament current and accelerator voltage are supplied to source 18 through power supply 15. Cable 20 suspends instrument 12 in well 10 and contains the required conductors for electrically connecting instrument 12 with the surface apparatus.
The outputs from LS and SS detectors 14 and 16 are coupled to detector board 22, which amplifies these outputs and compares them to an adjustable discriminator level for passage to channel generator 26. Channel generator 26 is a component of multi-channel scale (MCS) section 24 which further includes spectrum accumulator 28 and central processor unit (CPU) 30. As will be explained later, MCS section 24 accumulates spectral data in spectrum accumulator 28 by using a channel number generated by channel generator 26 and associated with a pulse as an address for a memory location. After all of the channels have had their data accumulated, CPU 30 reads the spectrum, or collection of data from all of the channels, and sends the data to modem 32 which is coupled to cable 20 for transmission of the data over a communication link to the surface apparatus. Also to be explained later is the further function of channel generator 26 in generating synchronization signals which control the pulse frequency of source 18, and further functions of CPU 30 in communicating control commands which define certain operational parameters of instrument 12 including the discriminator levels of detector board 22, and the filament current and accelerator voltage supplied to source 18 by power supply 15.
The surface apparatus includes master controller 34 coupled to cable 20 for recovery of data from instrument 12 and for transmitting command signals to instrument 12. There is also associated with the surface apparatus depth controller 36 which provides signals to master controller 34 indicating the movement of instrument 12 within well 10. The system operator accesses the master controller 34 to allow the system operator to provide selected input for the logging operation to be performed by the system. Display unit 40 and mass storage unit 44 are also coupled to master controller 34. The primary purpose of display unit 40 is to provide visual indications of the generated logging data as well as systems operations data. Storage unit 44 is provided for storing logging data generated by the system as well as for retrieval of stored data and system operation programs. A satellite link may be provided to send data and or receive instructions from a remote location.
In a well logging operation such as is illustrated by FIG. 2, master controller 34 initially transmits system operation programs and command signals to be implemented by CPU 30, such programs and signals being related to the particular well logging operation. Instrument 12 is then caused to traverse well 10 in a conventional manner, with source 18 being pulsed in response to synchronization signals from channel generator 26. Typically, source 18 is pulsed at a rate of 1000 bursts/second (1 KHz). This, in turn, causes a burst of high energy neutrons on the order of 14 MeV to be introduced into the surrounding formation to be investigated. In a manner previously described, this population of high energy neutrons introduced into the formation will cause the generation of gamma rays within the formation which at various times will impinge on LS and SS detectors 14 and 16. As each gamma ray thus impinges upon the crystal-photomultiplier tube arrangement of the detectors, a voltage pulse having an amplitude related to the energy of the particular gamma ray is delivered to detector board 22. It will be recalled that detector board 22 amplifies each pulse and compares them to an adjustable discriminator level, typically set at a value corresponding to approximately 100 KeV. If such pulse has an amplitude corresponding to an energy of at least approximately 100 KeV, the voltage pulse is transformed into a digital signal and passed to channel generator 26 of MCS section 24.
The system of the present invention may differ from the prior art system in that three detectors may be used. This has been discussed above. In addition, as would be known to those versed in the art, many of the functions of the components described with reference to FIG. 2 may be carried out by a processor. It should also be noted that the system described in FIG. 2 involves conveyance of the logging device into the well by a wireline. However, it is envisaged that the logging device could be part of a measurement while drilling (MWD) bottom hole assembly conveyed into the borehole by a drilling tubular such as a drillstring or coiled tubing.
In a multi-detector device, several measurements of capture cross-sections can be obtained. These measurements can be combined to create a combined capture cross-section: Σ comb = ω 1 ⁢ Σ 1 + ω 2 ⁢ Σ 2 + ⋯ ( 1 )
where Σi is the capture cross-section measured at detector i, and ωi is a corresponding weight of the ith capture cross-section. The weight of an individual capture cross-section can be typically determined by a statistical precision of the measurement. For example, the weight can be inversely proportionally to the standard deviation of the measurement at a given detector: ω i = 1 σ i 2 ( 2 )
where σ is the variance of the measurement of the ith detector. This weighting is done currently, for example, for C/O measurements. Variance can be measured in a variety of ways. As an example, with the RPM system, σ can be determined by measuring an average arrival time of the gamma rays at the detector, and relating this average time to a decay rate. The average time technique is a remarkably robust and statistically precise method of computing Σ.
The computation of the true or “intrinsic” formation sigma is complicated by the fact that the raw data from the instrument contain contributions from the borehole as well as from the formation. In general, the early part of the decay is most affected by neutron absorption in the borehole and the late decay by formation absorption, although they are not completely independent of each other. That is, the borehole influences the formation decay and the formation influences the borehole decay. A typical computation of sigma minimizes the borehole influence by using a late portion of the decay for the formation sigma calculation.
Combined pulsed neutron capture data from multiple detectors can be used in such a way as to improve the statistical precision and the accuracy of the measurement. The term “precision” refers, in a general sense, to the repeatability of the measurements, i.e., a more precise sensing device will give the same value for repeated measurements of the same parameter. The term “accuracy” refers to how close the output of a sensing device is to the true value of the quantity being measured. Thus, a precise measurement that has a bias is not an accurate measurement.
In a preferred embodiment of the invention, a weighted combination of data from two or more detectors is used to provide measurements with statistical precision superior to any one of the individual detectors alone. Such combinations will have measurement characteristics that are somewhat different from those of any individual detector alone. As discussed above, the XLS detector 107 achieves a higher degree of accuracy over the measured interval than measurements of the LS 105 and SS 106 detector. The XLS 107 detector will also have a lower resolution and lower precision than the LS and SS detectors. In the present invention, a measurement is obtained with an accuracy of a measurement from the XLS detector and a precision obtained from a weighted normalized Σcomb. This can be done in the manner described next.
Turning now to FIG. 3, one embodiment of the invention is shown. A first set of measurements, preferably the SS measurements, are smoothed 401 by a suitable filtering operation to match the resolution of a second set of measurements, preferably the XLS measurements. The resulting smoothed SS measurements has an even smaller standard deviation (higher precision) than the original SS measurements. The smoothed measurements are then combined 403 with a second set of measurements (preferably the XLS measurements) using eq. (1) to give a combined measurement. This combined measurement will be more accurate than the first measurements. U.S. Pat. No. 4,794,792 to Flaum, et al, discusses a step similar to the filtering carried out herein, but does not teach or suggest combining the measurements to give a measurement with improved accuracy. Next, the combined measurements are compared with the first measurements 405. Using this comparison, a normalization factor is determined 407 and applied 409 to the first measurements to give a normalized measurement. The normalized measurements will be more accurate than the first measurements. The normalization factor may be additive or multiplicative, depending upon the type of measurements being used. Optionally, the normalized measurements may be combined with the XLS measurements using eq. (1).
In a second, preferred embodiment of the invention, a sequence of steps similar to that outlined in FIG. 3 is carried out with one difference: the first set of measurements include both the SS and LS measurements. In this manner, a more precise and more accurate measurement with reasonably high resolution is obtained.
The processing of the data may be accomplished using a processor that may be located downhole or at an uphole location. Once the measurement accuracy and precision have been improved using the methods described above, the parameter of interest may be obtained using well known prior art techniques. As would be known to those versed in the art, parameters of interest that may be determined by nuclear logging tools include a density and a porosity of the earth formation.
The logging instrument as described above is suitable for use on a wireline or may be conveyed into the borehole on a measurement while drilling device using a drilling tubular such as a drillstring or coiled tubing. When a drilling tubular is used, the measurement apparatus is usually part of a bottom hole drilling assembly. Such conveyance devices are known in the art and are not discussed further here.
The present invention has been described with reference to a nuclear logging instrument. However, the method of the present invention may also be used with other types of logging instruments, including an acoustic logging instrument. In an acoustic logging instrument, signals generated from an acoustic source propagate through an earth formation and are detected at a plurality of spaced apart detectors. Dur to the passage through a dispersive earth formation, the signals suffer degradation at increased source-receiver distances.
Additionally, the method of the present invention may also be used when, for example, the first and second detectors are at the same distance from the source. However, if the second detector is sampled more frequently than the first detector, then the second detector will be less precise than and as accurate than the first detector.
While the foregoing disclosure is directed to the preferred embodiments of the invention, various modifications will be apparent to those skilled in the art. It is intended that all such variations within the scope and spirit of the appended claims be embraced by the foregoing disclosure.

PUM

no PUM

Description & Claims & Application Information

We can also present the details of the Description, Claims and Application information to help users get a comprehensive understanding of the technical details of the patent, such as background art, summary of invention, brief description of drawings, description of embodiments, and other original content. On the other hand, users can also determine the specific scope of protection of the technology through the list of claims; as well as understand the changes in the life cycle of the technology with the presentation of the patent timeline. Login to view more.

Similar technology patents

Method and device for forecasting reservoir yield

InactiveCN101906966AHigh precisionSurveyWellheadVolume factor
Owner:PETROCHINA CO LTD

Classification and recommendation of technical efficacy words

  • High precision
  • High resolution

Imaging optical lens assembly

ActiveUS8000031B1High resolutionReduce total track lengthLensPhysicsConcave surface
Owner:LARGAN PRECISION
Why Eureka
Try Eureka