Graphical user interface for adding measurements to existing distributed network troubleshooting system

Active Publication Date: 2005-05-26
VIAVI SOLUTIONS INC
View PDF2 Cites 64 Cited by
  • Summary
  • Abstract
  • Description
  • Claims
  • Application Information

AI Technical Summary

Benefits of technology

[0017] The present invention may be achieved by an apparatus comprising a graphical user interface providing a link to network related measurements by network analysis devices, to present a test including visually correlated network-related measurements by two or more of the network analysis devices through a selectable graphical display corresponding to the network analysis devices, and a selectable graphical display corresponding to at least one measurement for each selected network analysis device.
[0018] The present invention may also be achieved by a distributed computer network system, comprising a plurality of heterogeneous computer agents on a network and performing heterogeneous network-related measurements, and an apparatus in communication with the heterogeneous compute

Problems solved by technology

However, the conventional distributed network troubleshooting systems fail to provide such a correlation of one or more network analysis agent measurements from two or more network analysis agents, because in the conventional distributed network troubleshooting system, a user has to look at the data for the measurement from the San Francisco TNA 20b in one window, then in a different window look at the data from the Phoenix RMON 22a, and then mentally troubleshoot based upon the information in the two windows, which is difficult and very inefficient, and in particular not possible to mentally analyze the information from the two windows over a time line.
Of course, if more than two agent measurements are being analyzed, mental analysis is not effective.
More particularly, with the conventional distributed network troubleshooting systems, when a customer is dissatisfied with something happening on the network, such as connectivity failure, slow performance slow, etc, the customer calls the service provider.
Although there are some distributed network troubleshooting systems that allow running measurements on multiple devices, the problem with such conventional systems is that the system presents a separate display window or a separate g

Method used


Image

  • Graphical user interface for adding measurements to existing distributed network troubleshooting system
  • Graphical user interface for adding measurements to existing distributed network troubleshooting system
  • Graphical user interface for adding measurements to existing distributed network troubleshooting system

Examples


Embodiment Construction

[0033] Reference will now be made in detail to the present embodiments of the present invention, examples of which are illustrated in the accompanying drawings, wherein like reference numerals refer to the like elements throughout. The embodiments are described below to explain the present invention by referring to the figures.

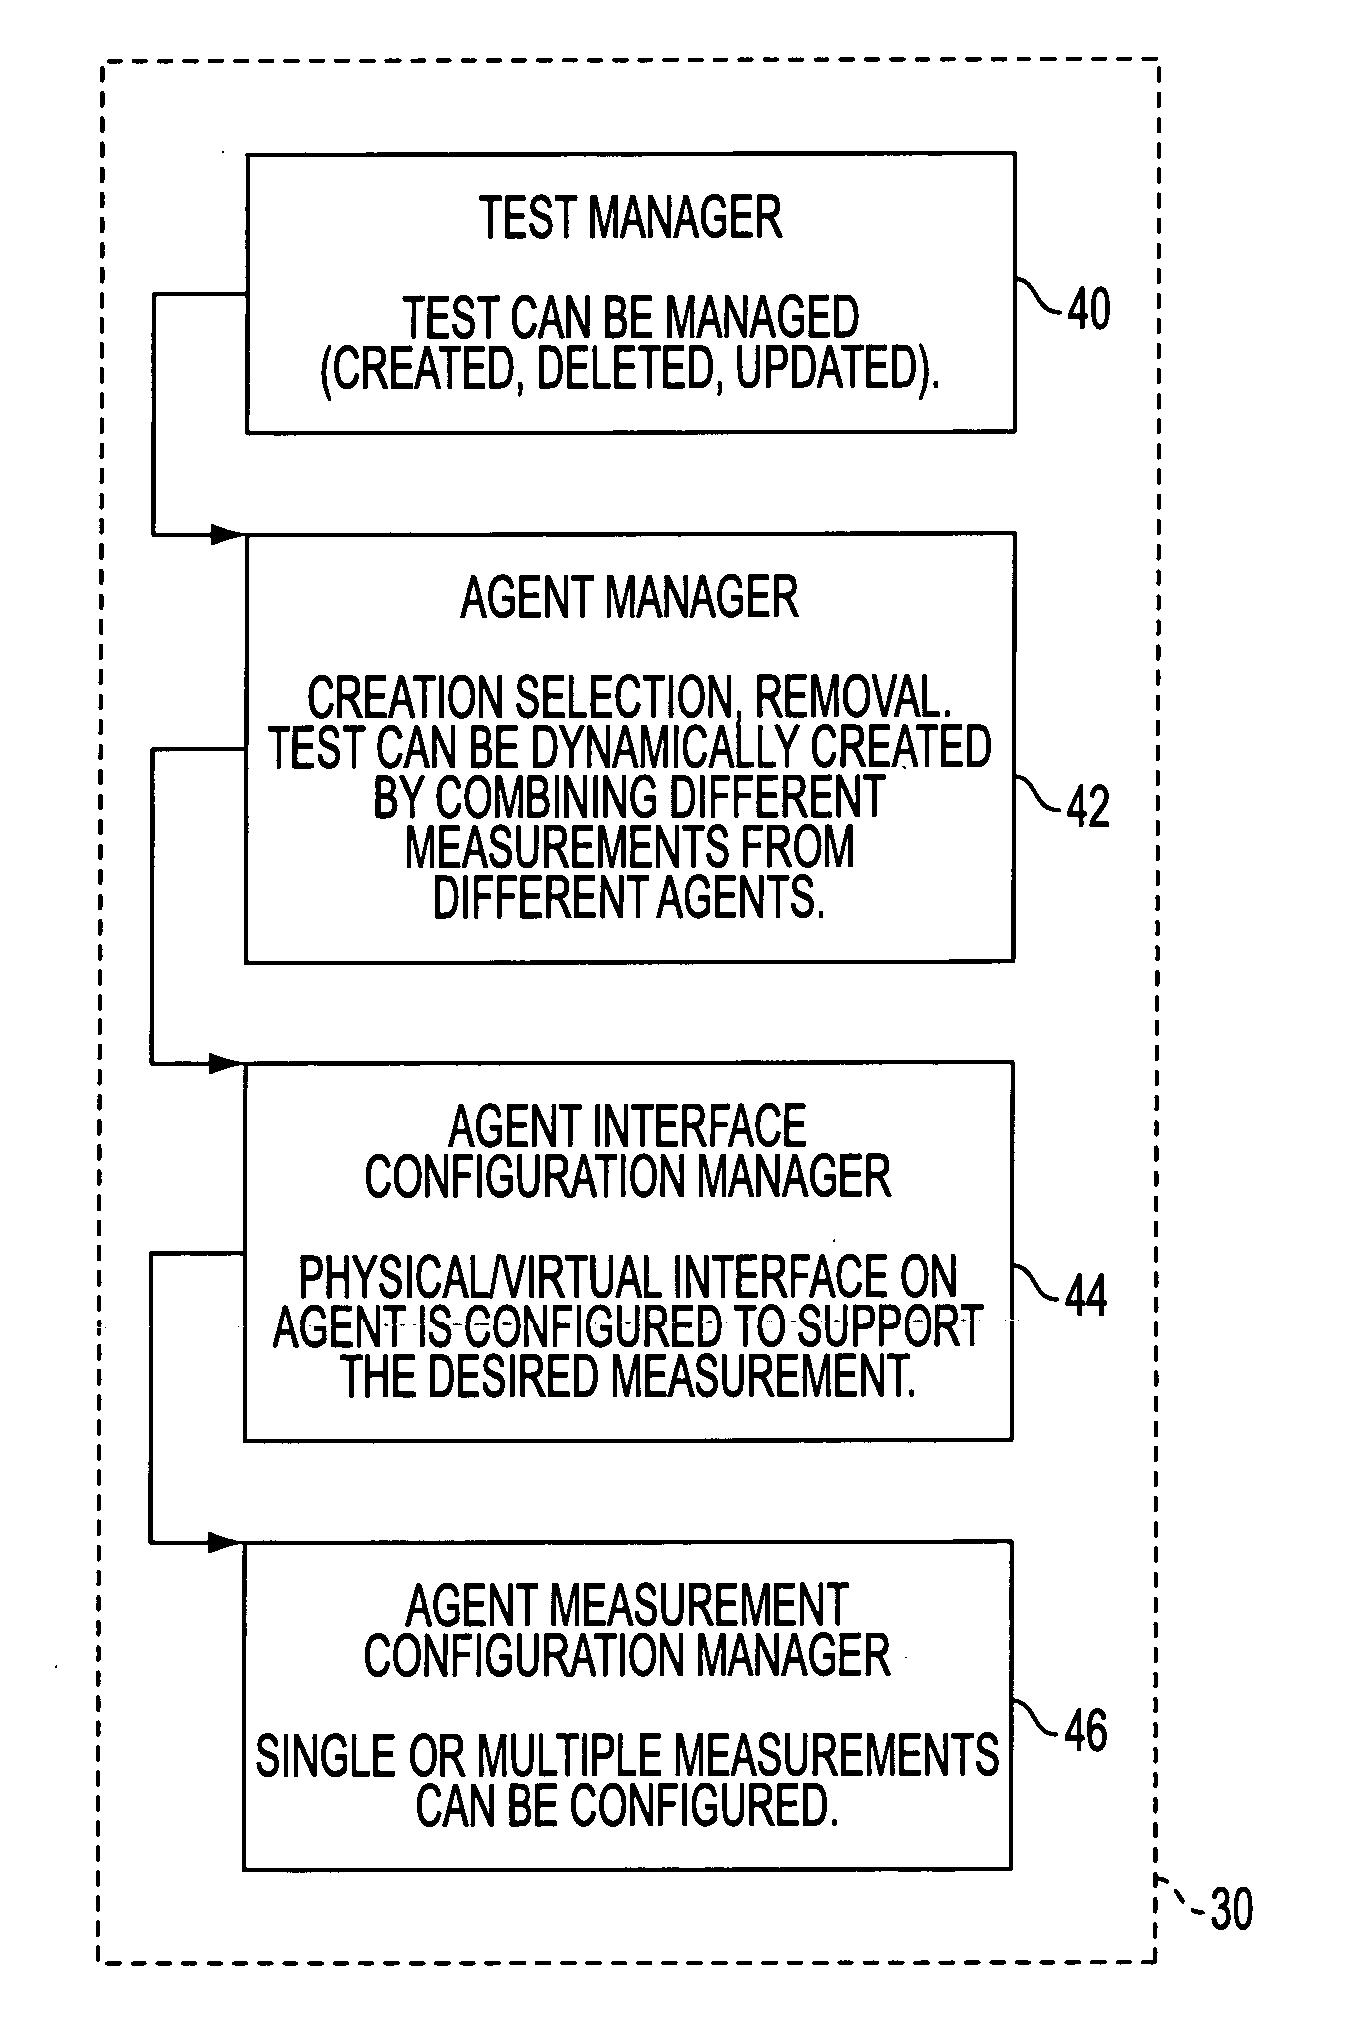
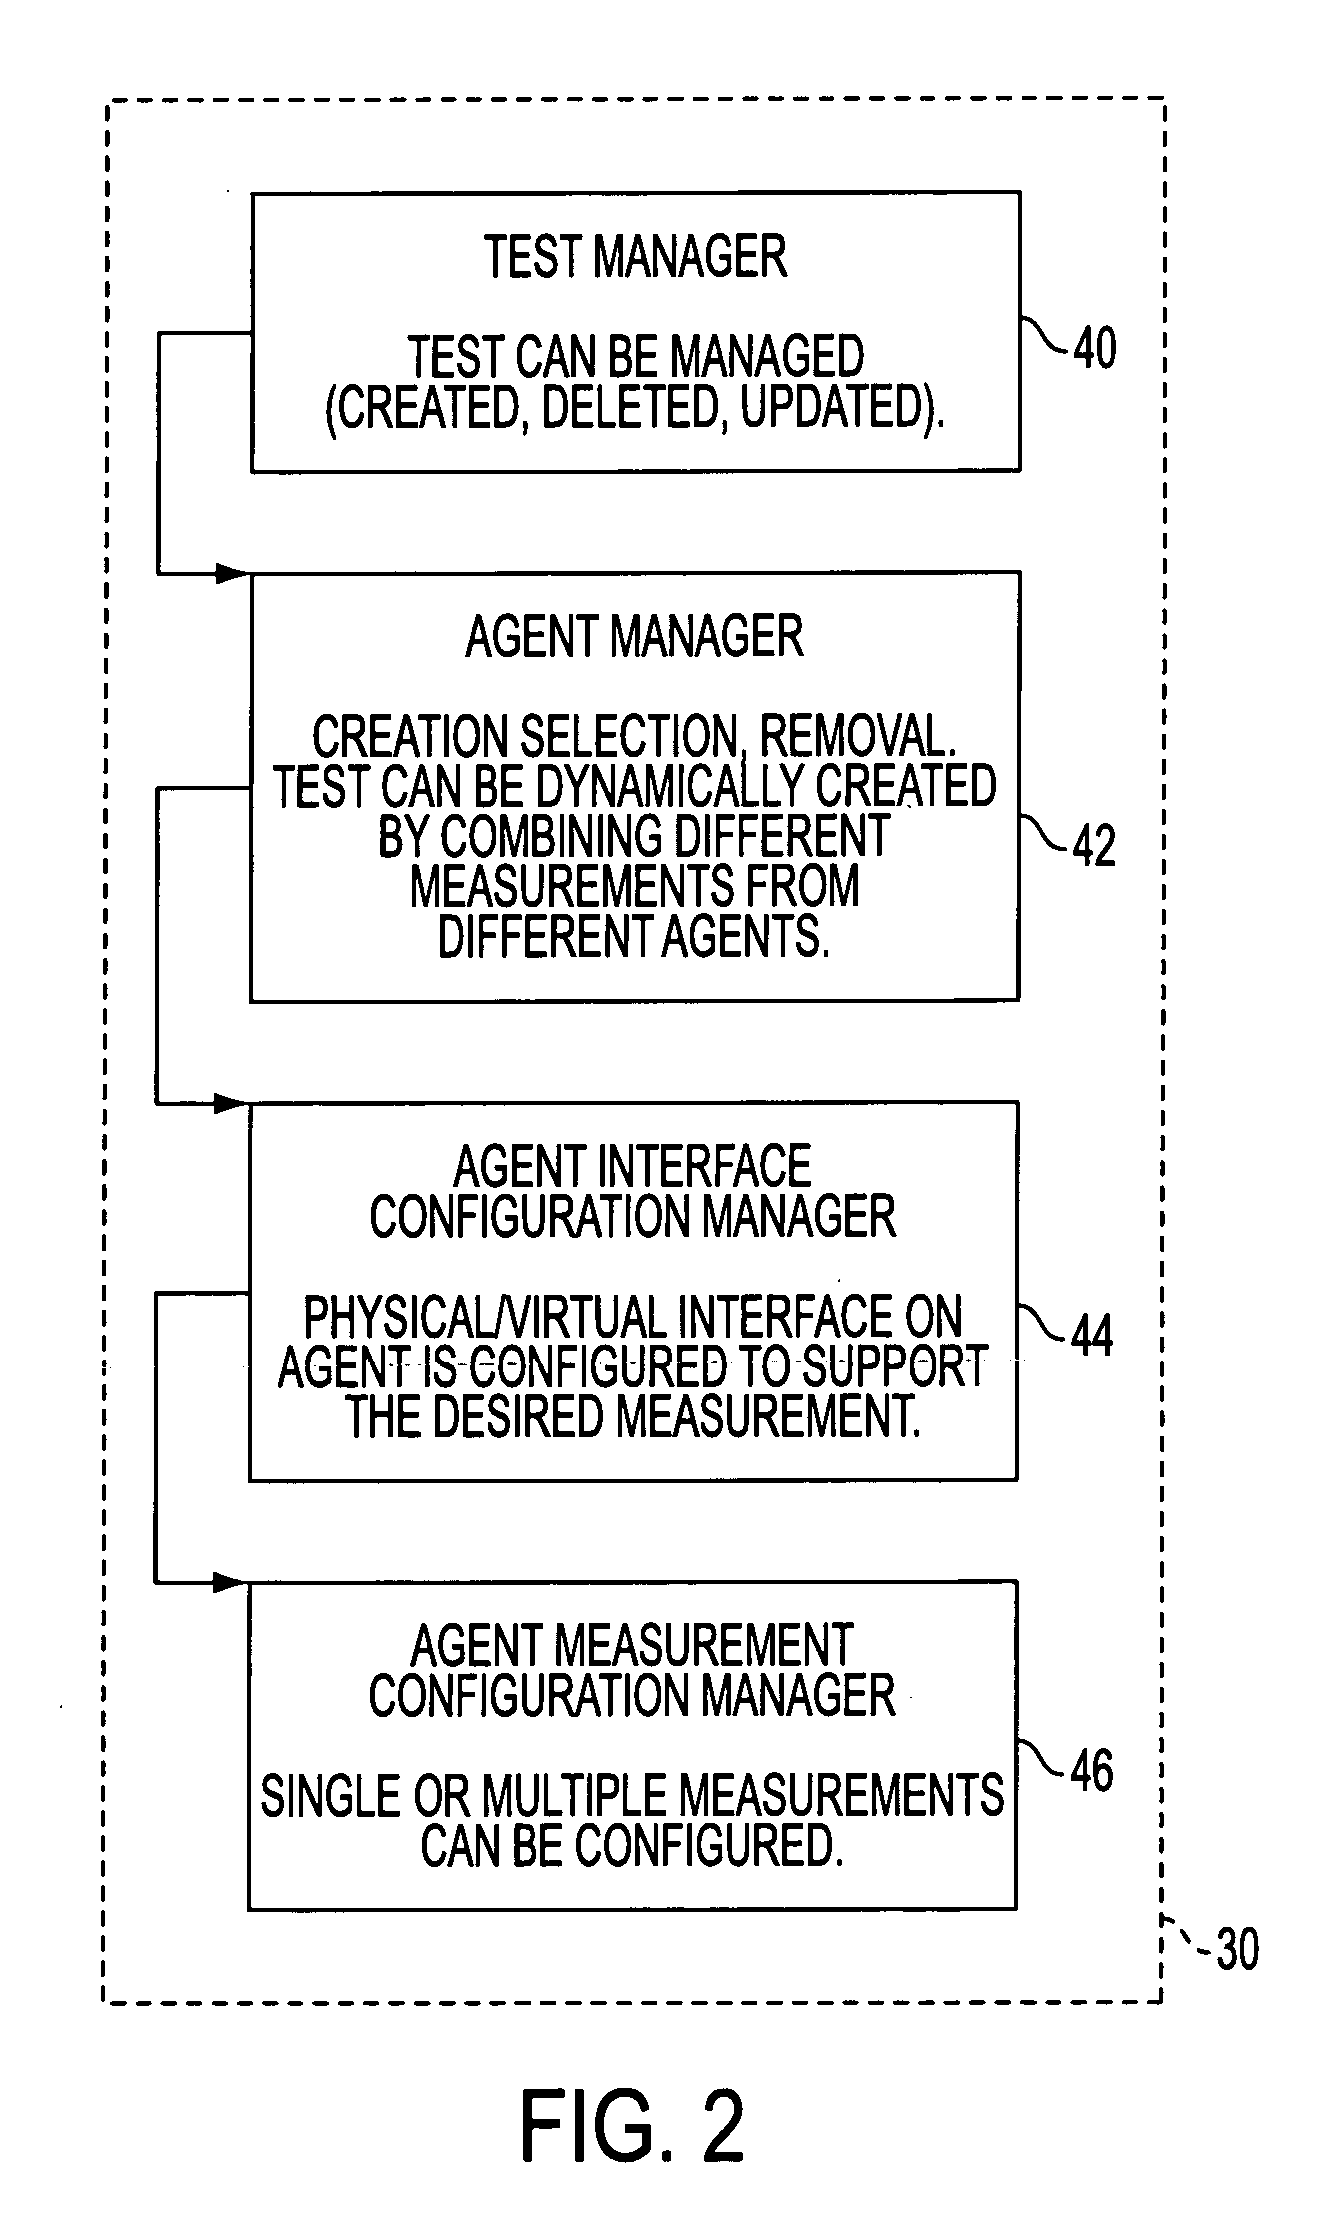
[0034]FIG. 2 is a functional block diagram of a graphical user interface 30 for adding tests to a distributed network troubleshooting system (network-related measurement test GUI), according to an embodiment of the present invention. As shown in FIG. 2, typically, the network test GUI is segmented according to logical functions implemented as software objects, typically, Java programming language objects, comprising a test manager 40, an agent manager 42, agent interface configuration manager 44, and agent measurement configuration 46. Each GUI manager 40, 42, 44, and 46 presents a GUI allowing adding network-related measurements from different network analys...


PUM


Abstract

A graphical user interface provides a link to network related measurements by network analysis devices, to present a test including perceptibly correlated network-related measurements by two or more of the network analysis devices through a selectable graphical display corresponding to the network analysis devices, and a selectable graphical display corresponding to at least one measurement for each selected network analysis device. The test provides a newly added measurement.

Description

BACKGROUND OF THE INVENTION [0001] 1. Field of the Invention [0002] The present invention is directed to a graphical user interface to a test as a collection of correlated network-related measurements on a distributed network troubleshooting system. More particularly, the present invention is directed to a user interface allowing a user to add measurements from different network analysis devices into a test so that those measurement results can be visually correlated. [0003] 2. Description of the Related Art [0004]FIG. 1 is a diagram of a conventional distributed networking problem domain in which a plurality of network analysis agents (network troubleshooting agents) 20a-n, 22a-n, and 24a-n (NAs) provided on networks 26a-n (network 16), measure how the network 26 performs as network devices (computers) 28a-n perform their respective jobs (e.g., data communication) on the network 16. [0005] In FIG. 1, as an example, the network 16a is an Internet Protocol (IP) network, the networks ...

Claims


Application Information

Patent Timeline
IPC IPC(8): H04L12/26G06F15/173G09G5/00H04L12/24H04L12/56
CPCH04L12/2602H04L41/046H04L41/22H04L43/0882H04L43/0829H04L43/087H04L43/00
Inventor MONK, JOHN M.KROBOTH, ROBERT H.
Owner VIAVI SOLUTIONS INC
Why Eureka
Try Eureka