Method for determining the equivalency index of products and processes

a technology of equivalency index and product, applied in the field of statistical quality control, can solve the problems of less effective quantification of quality, less useful statistical quality control methods and tools for such purposes, and shifted the burden

Active Publication Date: 2005-06-30
TEXAS INSTR INC
View PDF2 Cites 2 Cited by
  • Summary
  • Abstract
  • Description
  • Claims
  • Application Information

AI Technical Summary

Problems solved by technology

Over time, market competition has shifted that burden to the producers.
The application of these tools, however, has a common shortcoming—they are less effective in quantifying the quality-equivalency among products—a necessity in today's commerce.
The traditional statistical quality control methods and tools are less useful for such purposes—it is difficult with traditional tools to compare products or processes and to reach an unambiguous conclusion as to the degree of equivalency between the compared items and to express it in a concise and numerical format.

Method used


Image

  • Method for determining the equivalency index of products and processes
  • Method for determining the equivalency index of products and processes
  • Method for determining the equivalency index of products and processes

Examples


first embodiment

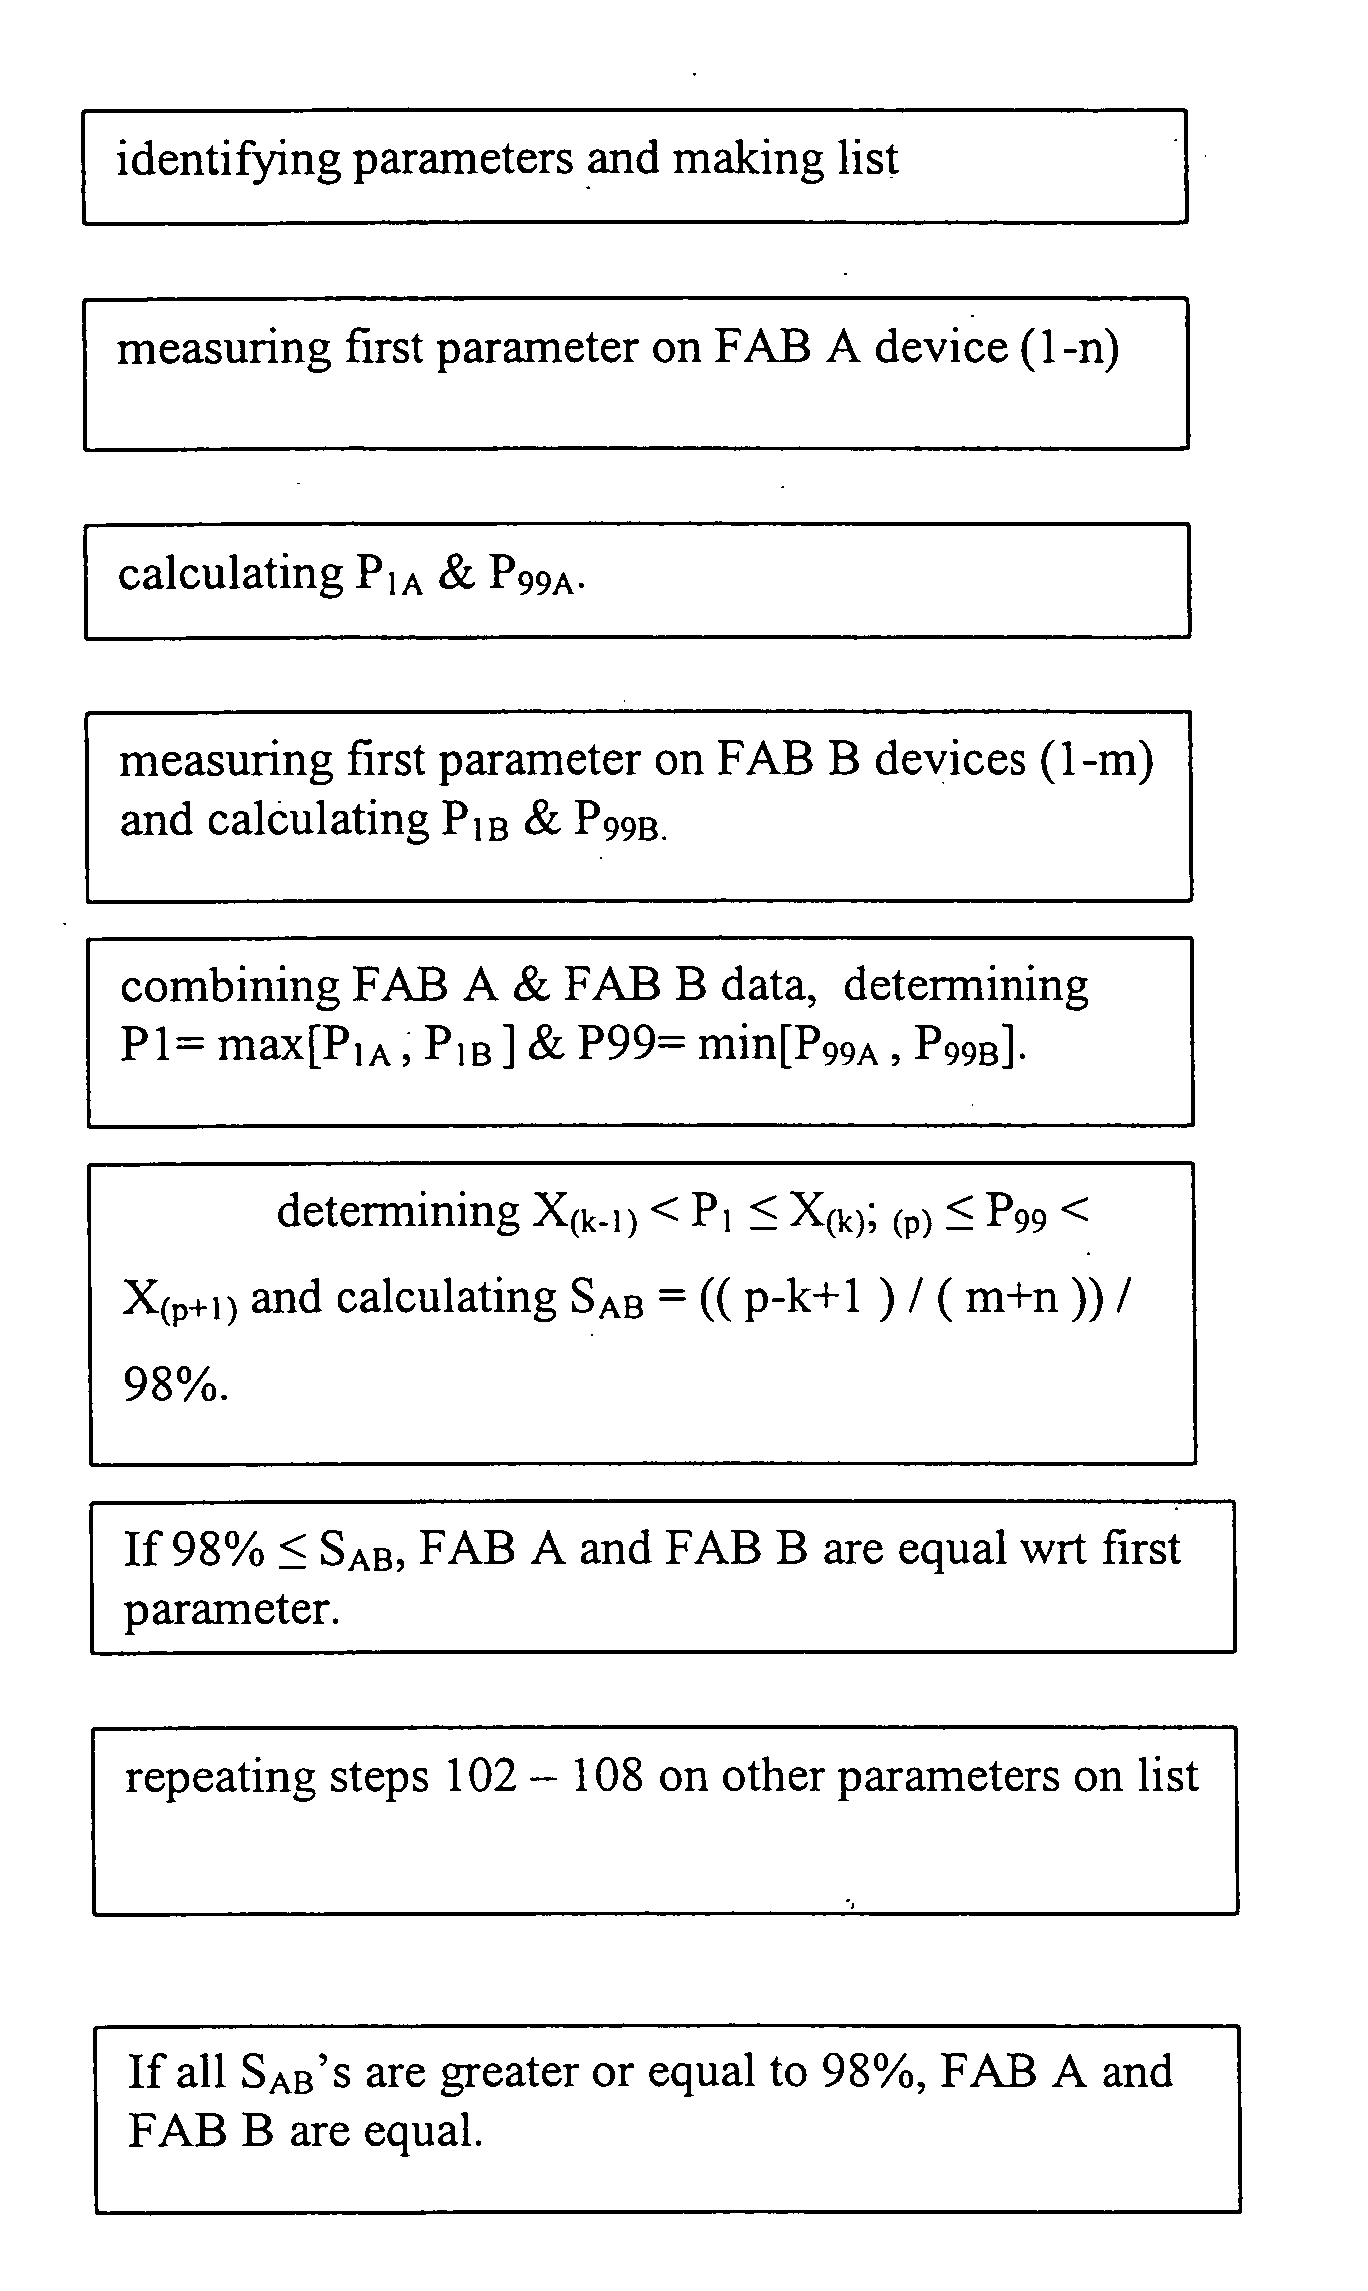
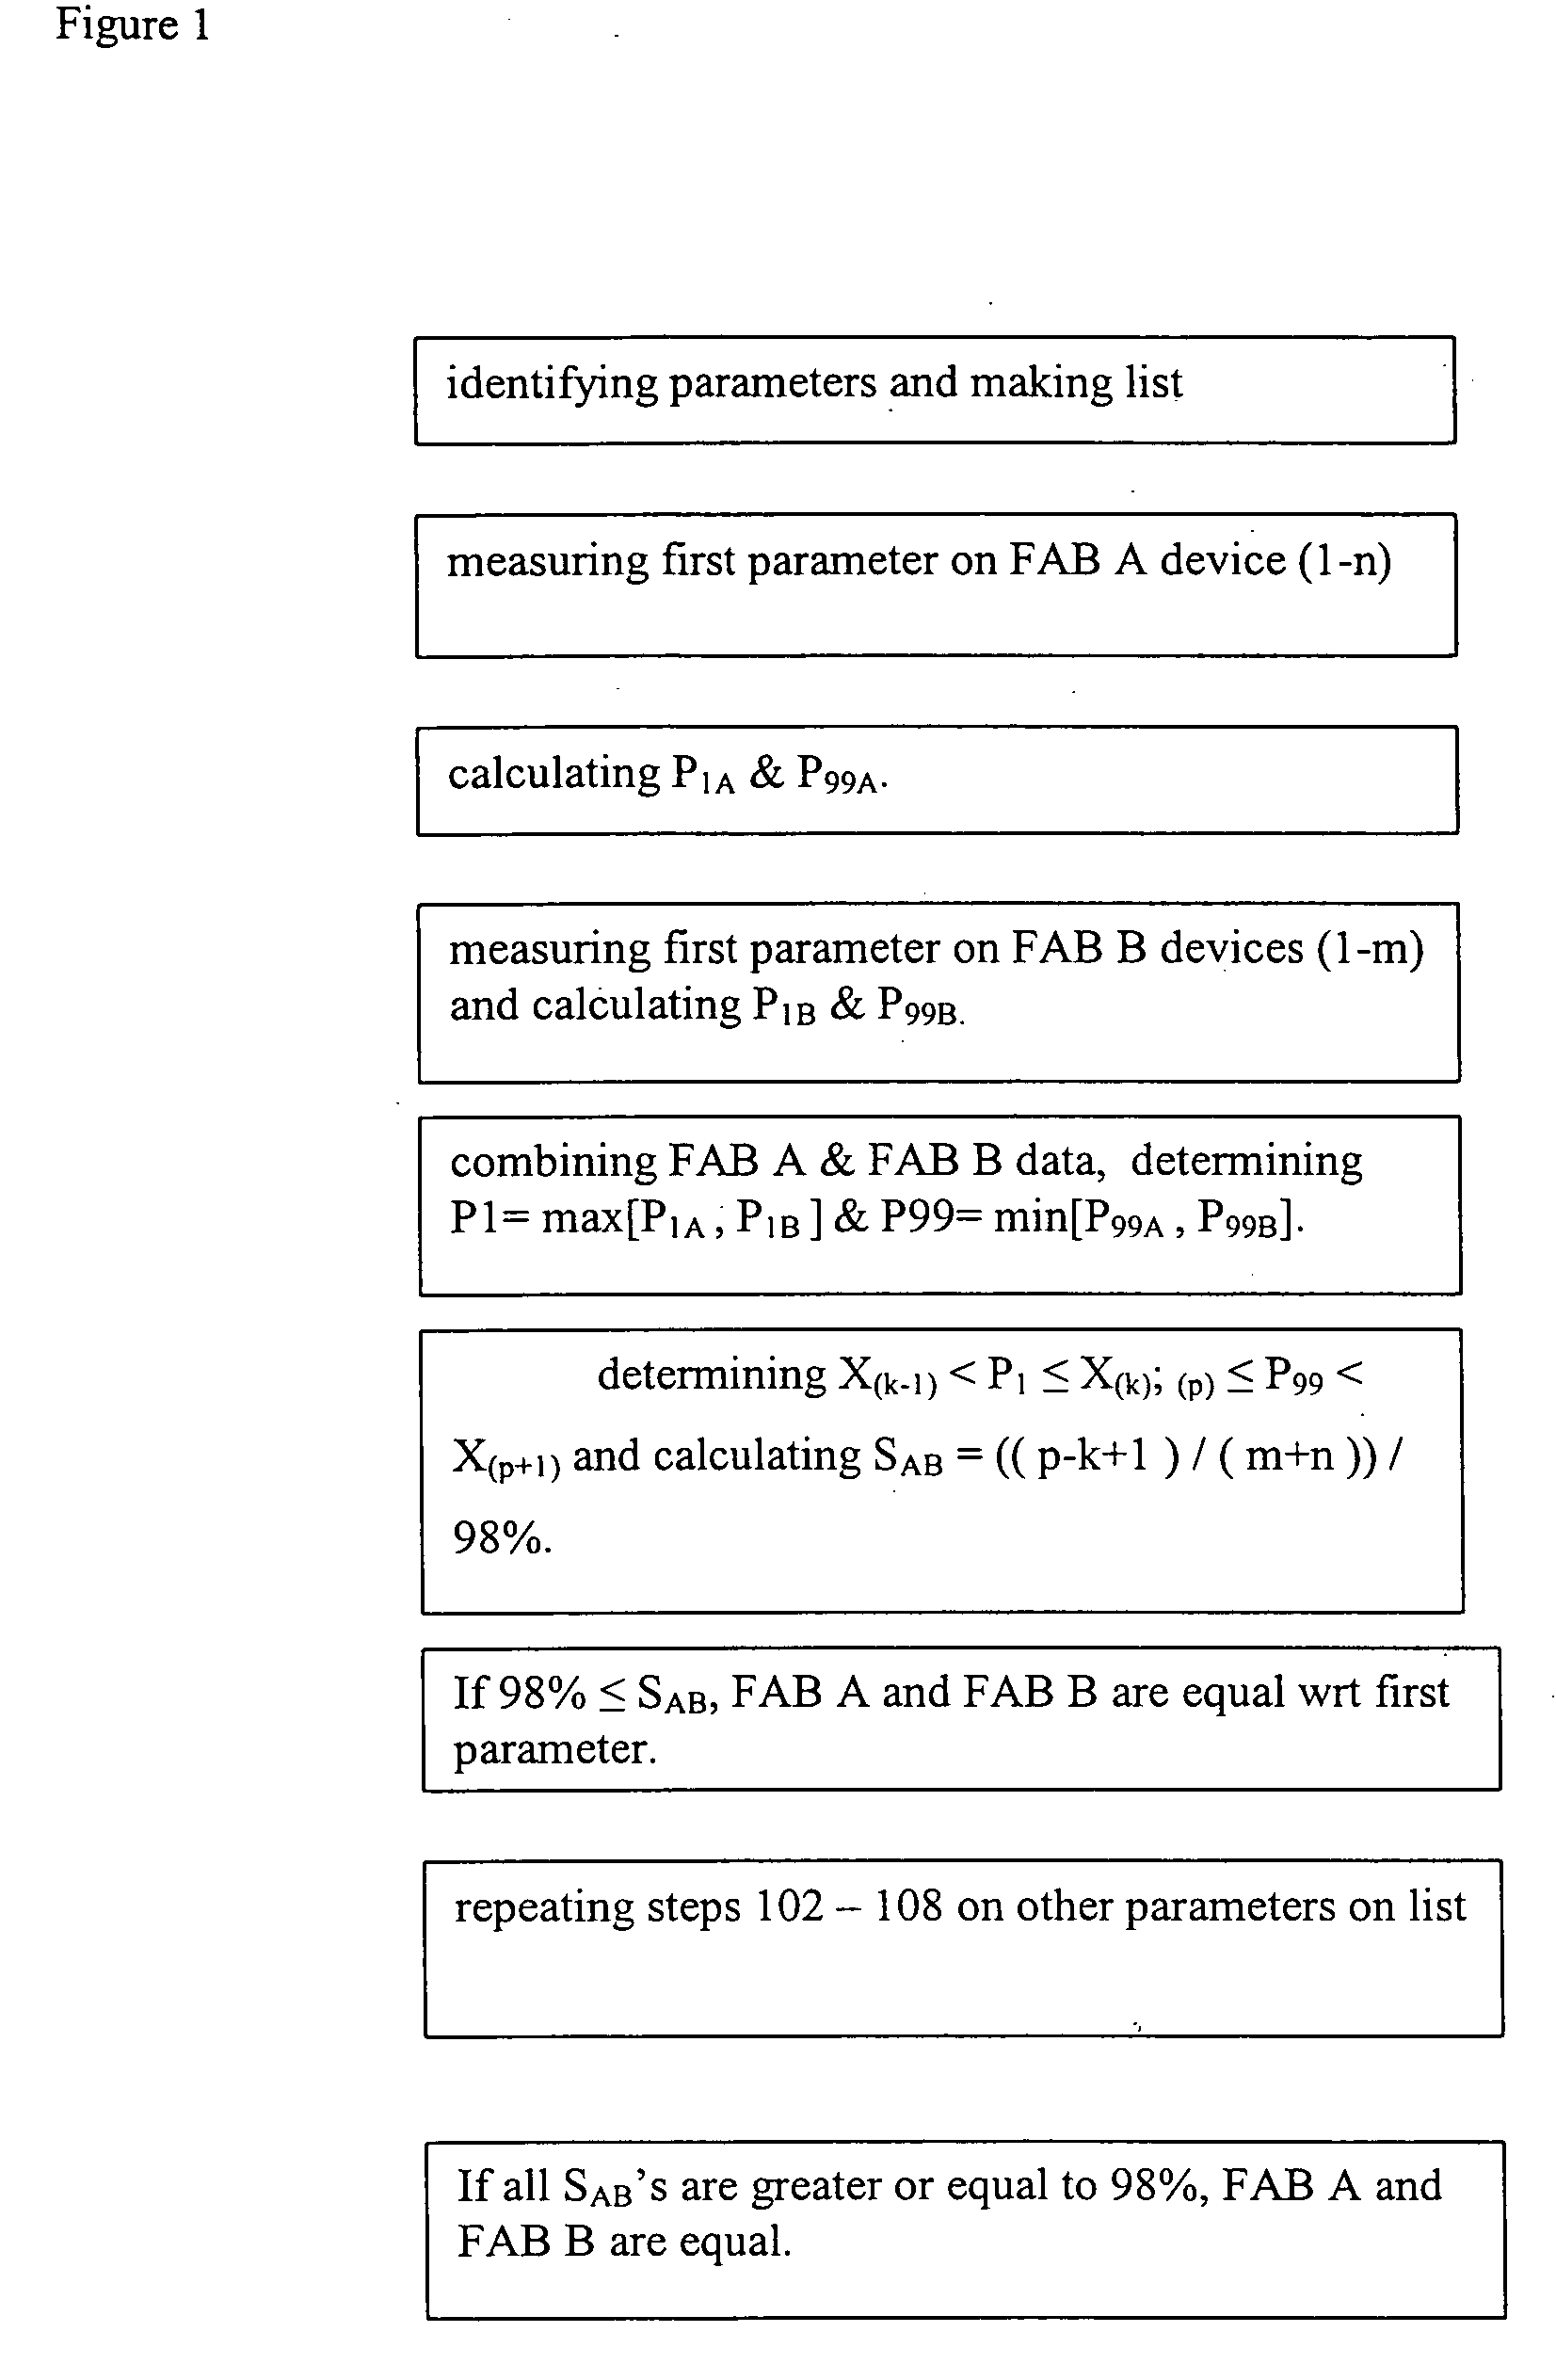
[0017]FIG. 1 depicts an example of this invention. In this example, the steps of a method are described with which an IC device manufacturer may determine whether IC devices fabricated at two of its manufacturing facilities (FABs) are statistically equivalent. The invention applies to situations where more than two FABs are compared. This two-FAB example is for illustrative purpose.

[0018] In step 101, the method requires one to identify one or more measurable and quantifiable device-parameters that, in total, reflect the quality of the devices. The number of parameters that are necessary to make this equivalency determination may be large or small, depending on the complexity of the process and the economy of the operation. In modern semiconductor integrated circuit products, one may choose parameters of a typical transistor in the integrated circuit, such as the transistor channel length, the gate oxide thickness, the drive current, gate to substrate leakage current etc.

[0019] In ...

second embodiment

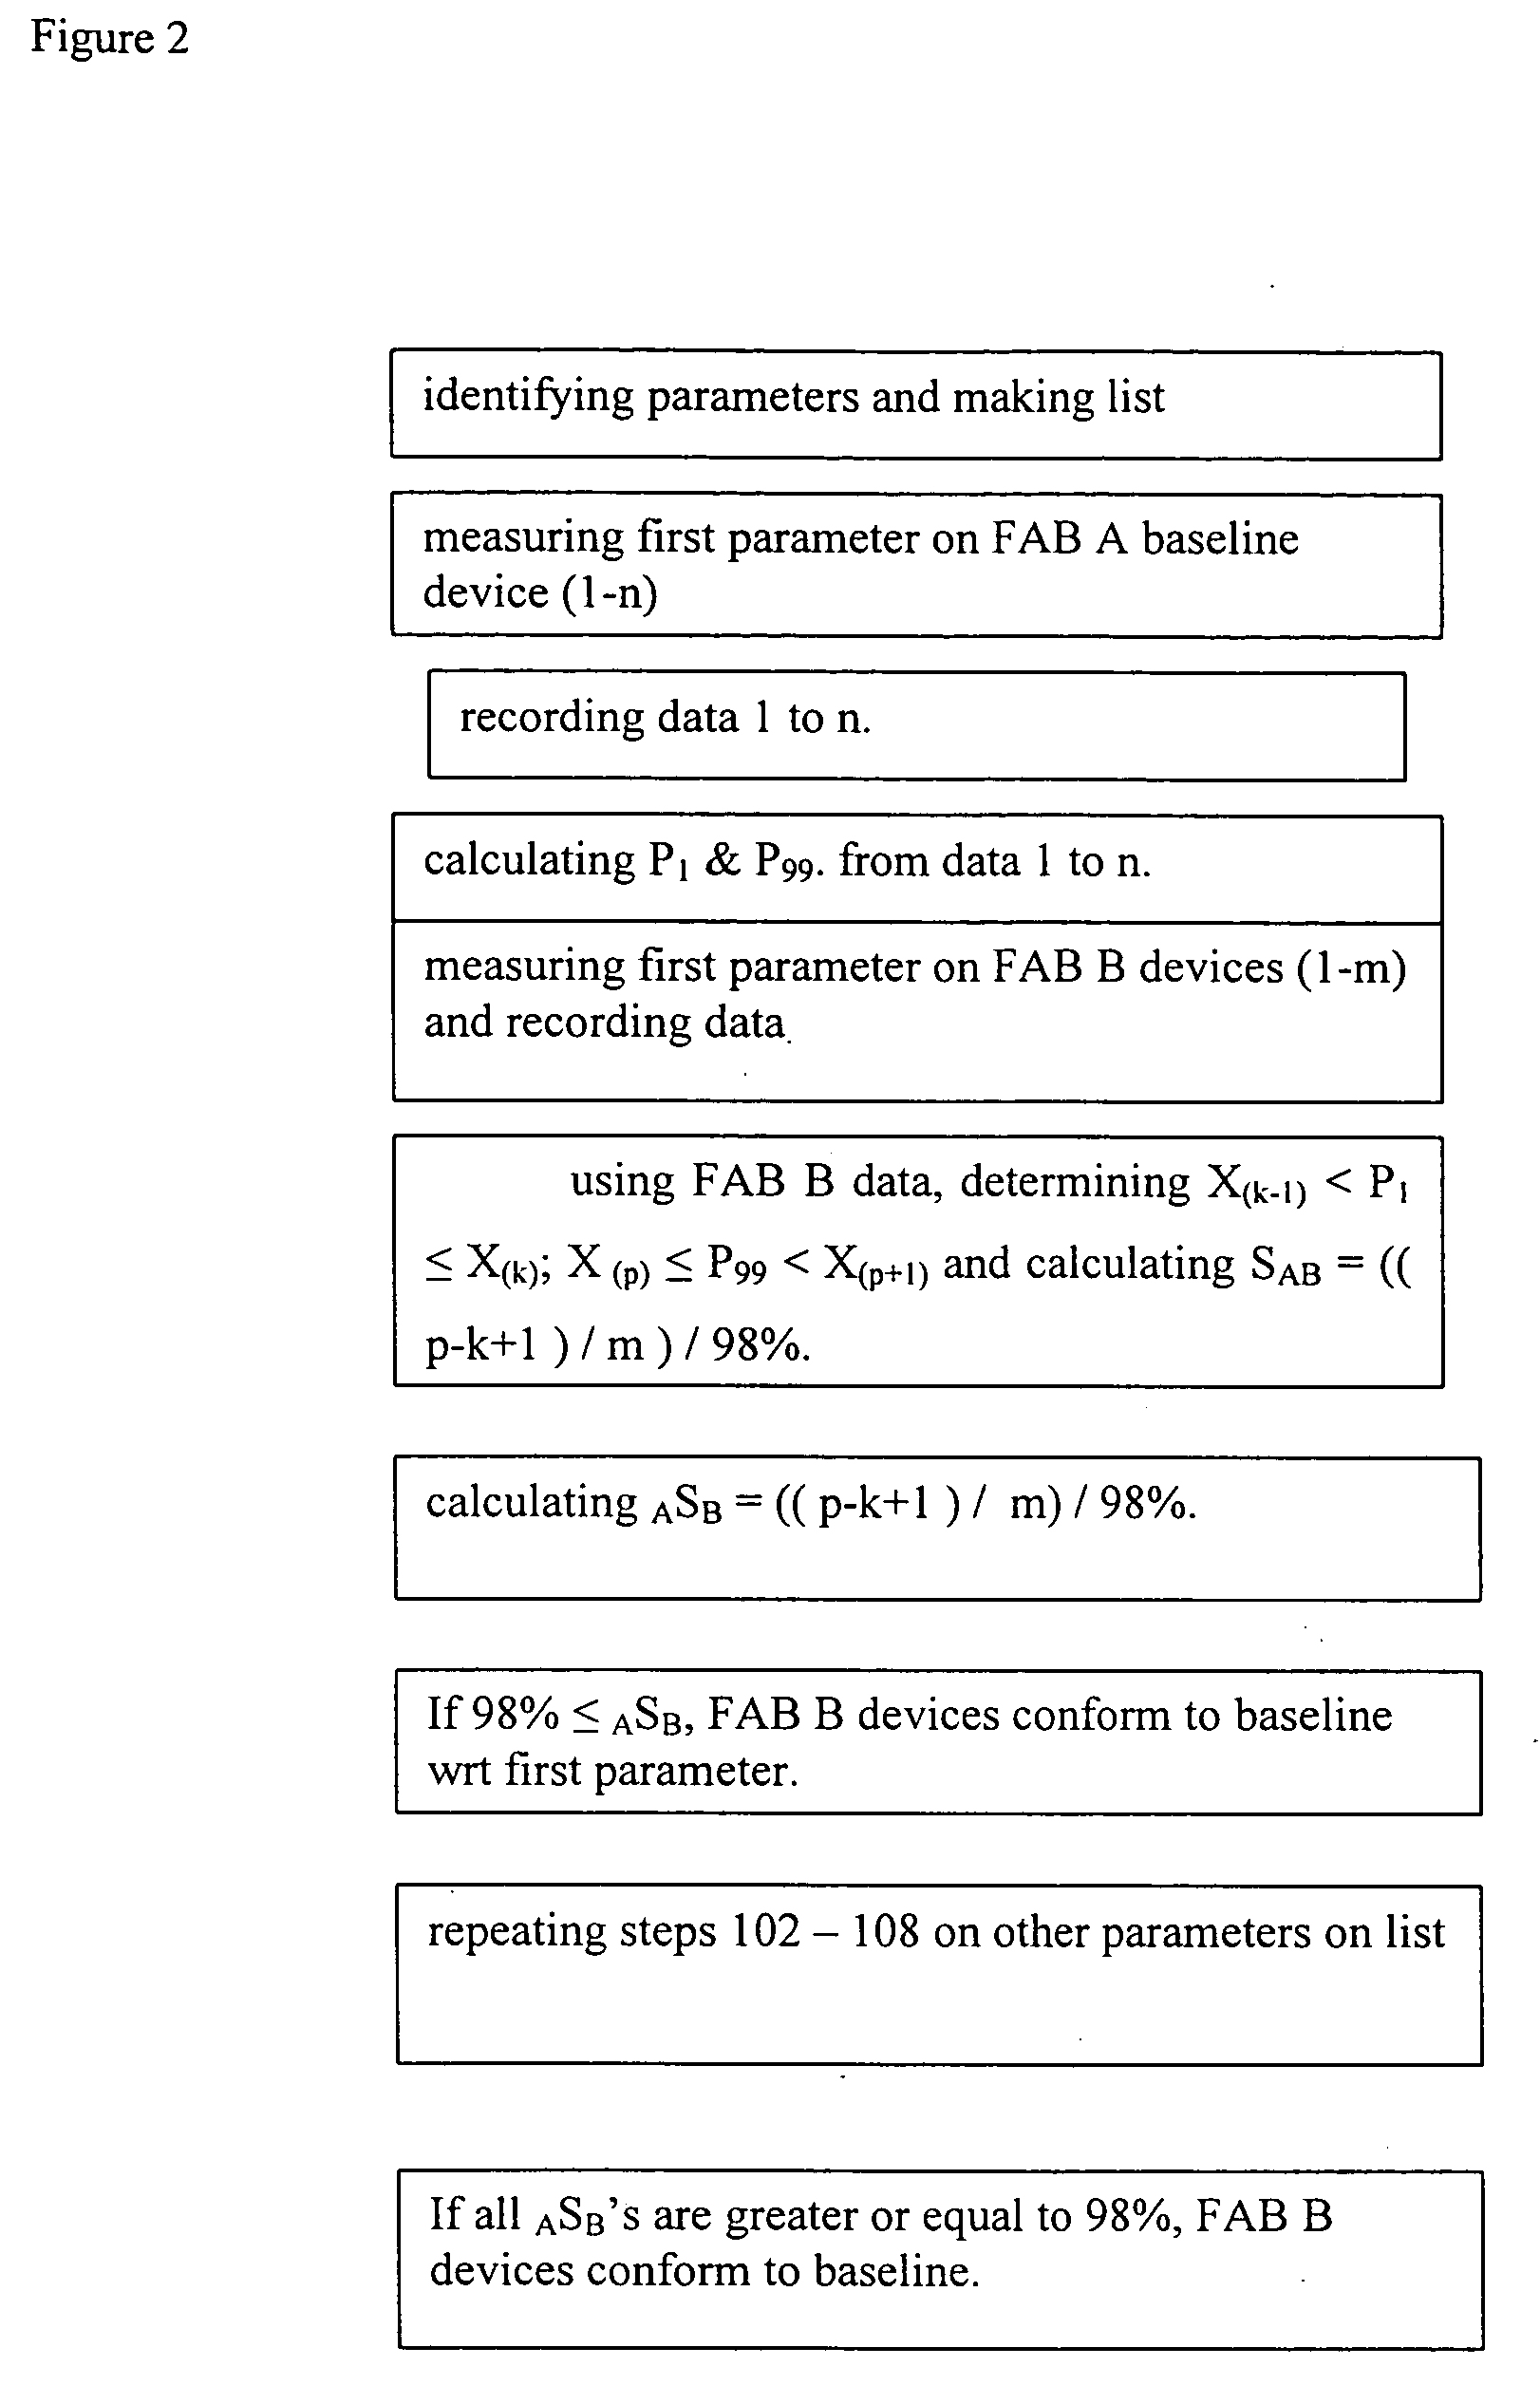
[0029]FIG. 2 depicts an example of this invention. In this example, the steps of a method are described with which an IC device manufacturer may determine whether IC devices fabricated at FAB B are statistically equivalent to devices fabricated with a baseline process in FAB A, which may have been qualified by a customer. The purpose of the comparison may be to qualify a FAB B to add production capacity for the same customer.

[0030] In step 201, as in step 101, one identifies one or more measurable and quantifiable device-parameters that, in total, reflect the quality of the manufacturing process.

[0031] In step 202, as in step 102, one measures the first parameter identified in step 201. In this example, one may again choose the transistor drive-current as the parameter and measure a group of ICs manufactured in FAB A with the baseline process.

[0032] In step 203, as in step 103, one records the data.

[0033] In step 204, one selects a lower limit and an upper limit from the data. In...

third embodiment

[0041]FIG. 3 depicts an example of this invention. In this example, the steps of a method are described with which an IC device manufacturer may determine whether devices fabricated at a FAB or at a plurality of FABs conform statistically to some pre-determined limits. The limits may be generated from a base-line process, they may be historical values, limitations supplied by a customer or it may be a mandate from a governmental regulatory agency.

[0042] In step 301, one identifies the device-parameter or parameters based on which one determines the conformity of the devices.

[0043] In step 302, as in steps 102 and 202, one measures and records the first parameter in step 301. In this example, the transistor drive-current is used again as the parameter. And the drive-currents of a group of ICs manufactured in FAB A are taken.

[0044] In step 303, as in steps 103 and 203, one records the measured data in step 302.

[0045] In step 305, one arranges the data of measurements from steps 303...


PUM


Abstract

A method is disclosed wherewith a person skilled in the art of statistical quality control may use to determine whether a process or a product is statically equivalent to another of known quality, or conforms to a desired known quality. The method may also be used to determine whether multiplicities of products or processes are statistically equivalent to one another. The method makes the determination based calculating an equivalency index that is associated with the measured parametric data, the population ratio of data points within a set of parametric limits.

Description

BACKGROUND OF THE INVENTION [0001] 1. Field of the Invention [0002] This invention is related to field of statistical quality control and more specifically related to a method of determining the degree of equivalency between products and between processes. [0003] 2. Description of the Related Art [0004] Each item of manufacture, each service rendered, and each process of manufacture possesses a number of measurable attributes that jointly constitute what a user considers as quality. These attributes are often called quality characteristics. Quality characteristics may be physical such as length, weight, voltage, and viscosity, or sensory such as taste, appearance, color, and ease of use, or time orientation such as reliability, and durability. [0005] In the past, the buyers of a product were advised to examine and test the product for quality before a purchase. Over time, market competition has shifted that burden to the producers. Today's manufacturers not only must screen their pr...

Claims


Application Information

Patent Timeline
Patent Type & Authority Applications(United States)
IPC IPC(8): G01M99/00H01L21/00
CPCG06Q30/02
Inventor DOBSON, JOEL L.WANG, EUGENE Y.
Owner TEXAS INSTR INC
Why Eureka
Try Eureka