Systems and methods for risk stratification of patient populations

Active Publication Date: 2005-09-15
TERUMO MEDICAL CORP
View PDF10 Cites 138 Cited by
  • Summary
  • Abstract
  • Description
  • Claims
  • Application Information

AI Technical Summary

Benefits of technology

[0039]FIG. 9 shows a descriptive statistical model including a plot of scores from two different health status domains including SAQ Angina Frequency Score and SAQ Disease Perception/Qual

Problems solved by technology

However, the application of such models to clinical practice has been limited by both their complexity and the lack of a practical mechanism for making them available at the time of medical decision-making.
Currently, these models remain largely academic and without a practical method or mechanism for being used in routine clinical care.
Once these tests identify patients with an adverse prog

Method used


Image

  • Systems and methods for risk stratification of patient populations
  • Systems and methods for risk stratification of patient populations
  • Systems and methods for risk stratification of patient populations

Examples


example 1

Survey Data Collection

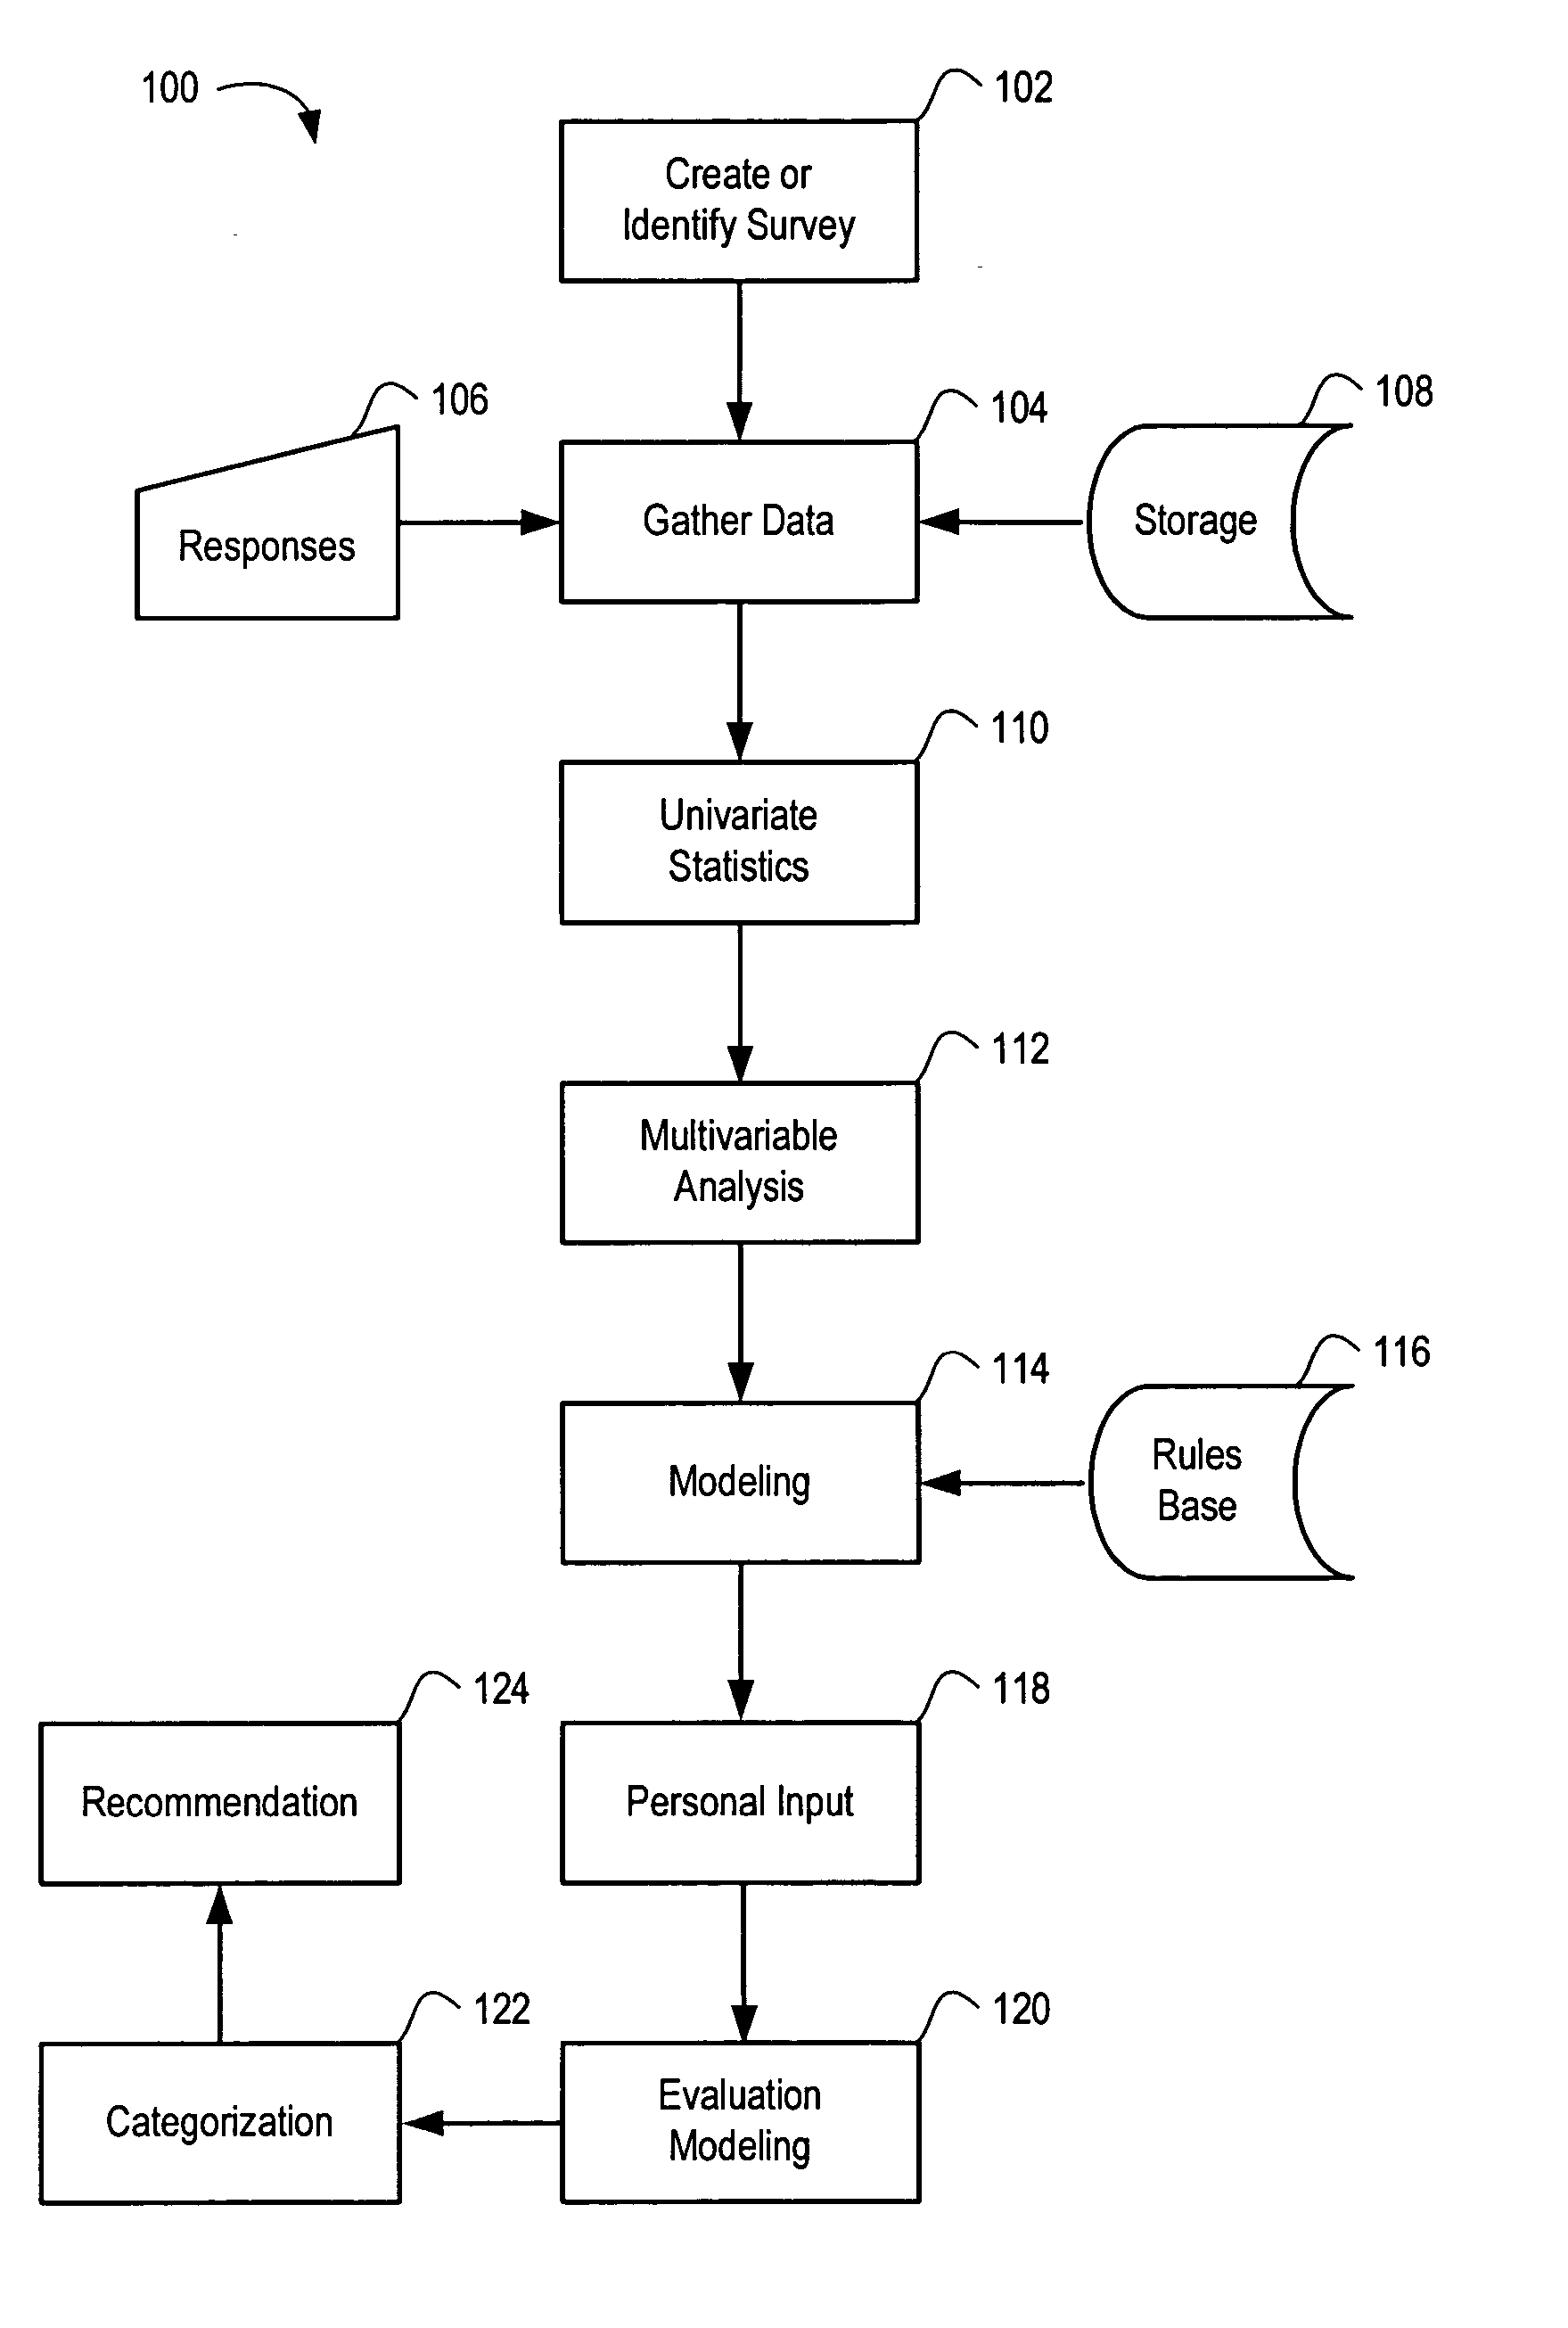
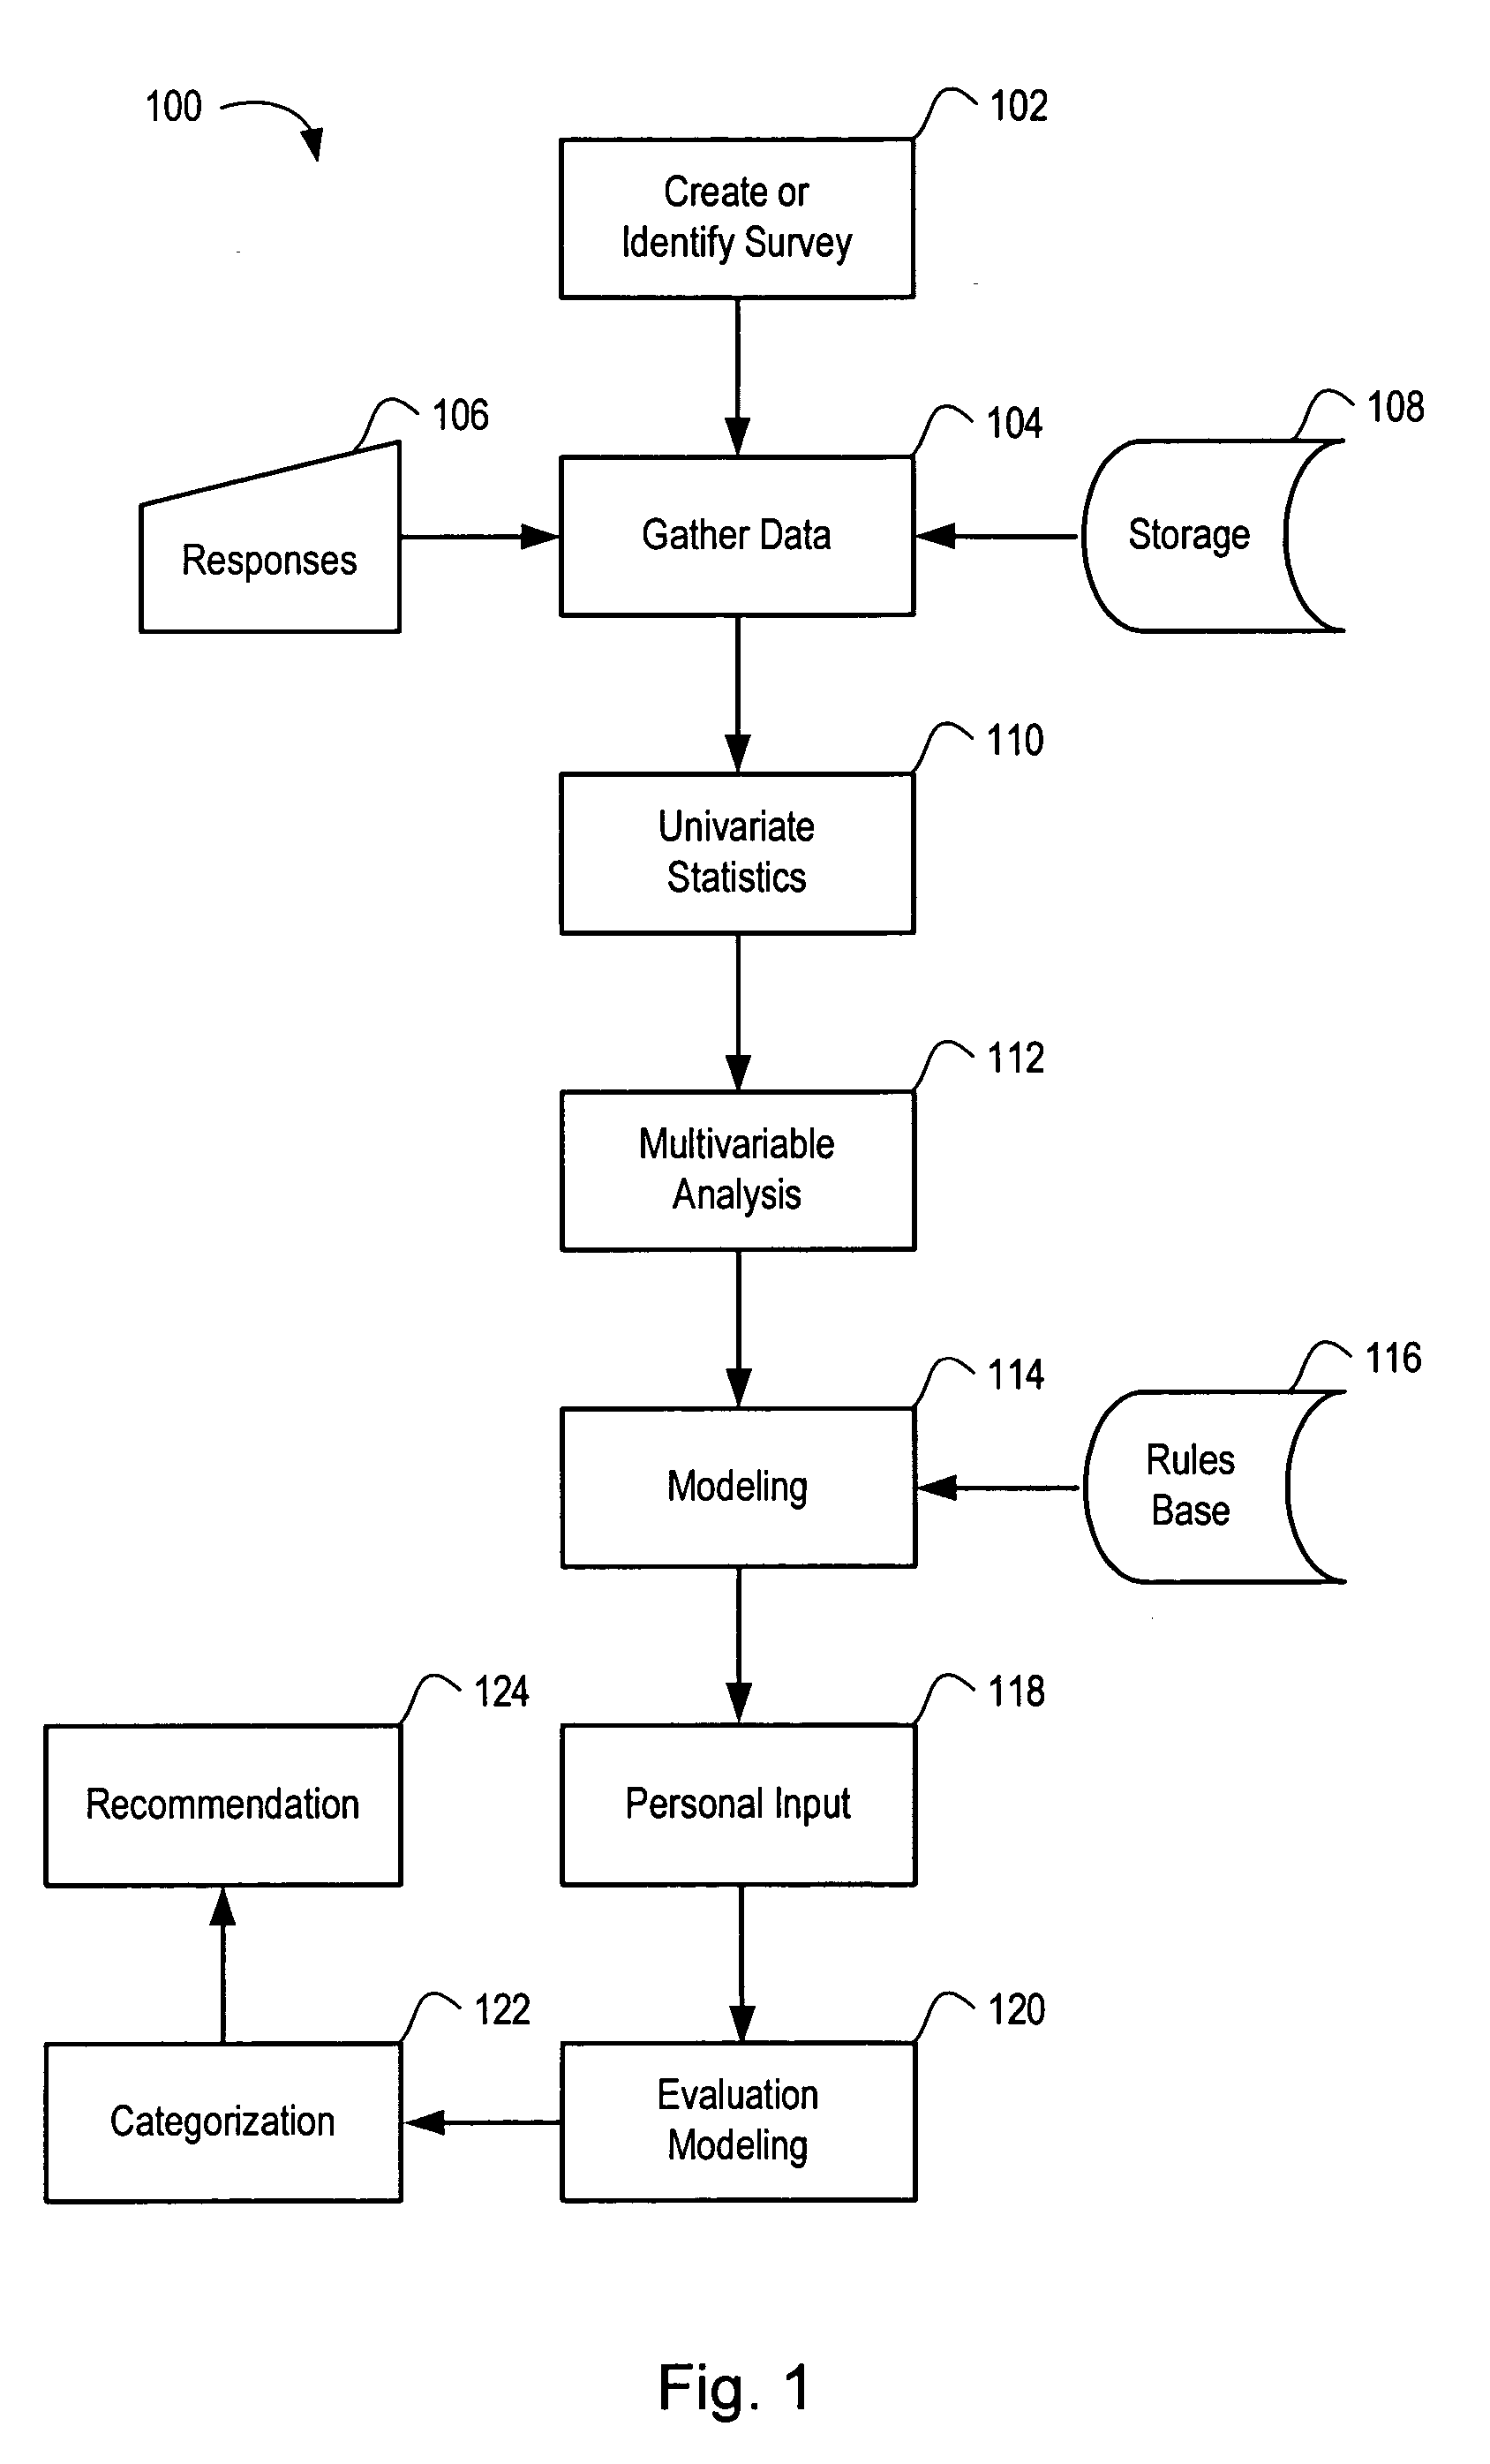
[0113] Example 1 demonstrates data collection techniques for gathering data that were used as steps 102 and 104 of FIG. 1. In some cases, an expert devised questions to obtain data possibly having some relevancy in assessing prognostic outcomes. In other cases, a well-accepted study may be selected for this purpose.

[0114] A literature search identified the SAQ as a leading survey pertaining to health status of acute coronary syndromes (ACS) or coronary artery disease (CAD). A total of 5,558 Veteran's Administration patients reporting coronary artery disease were administered the SAQ. Patient responses to the SAQ were evaluated by conventional SAQ assessment techniques to provide scores assessing physical limitation characteristics according to traditional risk variables including physical limitation, angina stability, angina frequency, CAD-specific treatment satisfaction and quality of life. The patients were also asked to provide demographic information and ...

example 2

Statistical Processing of Life Survey Data Collection

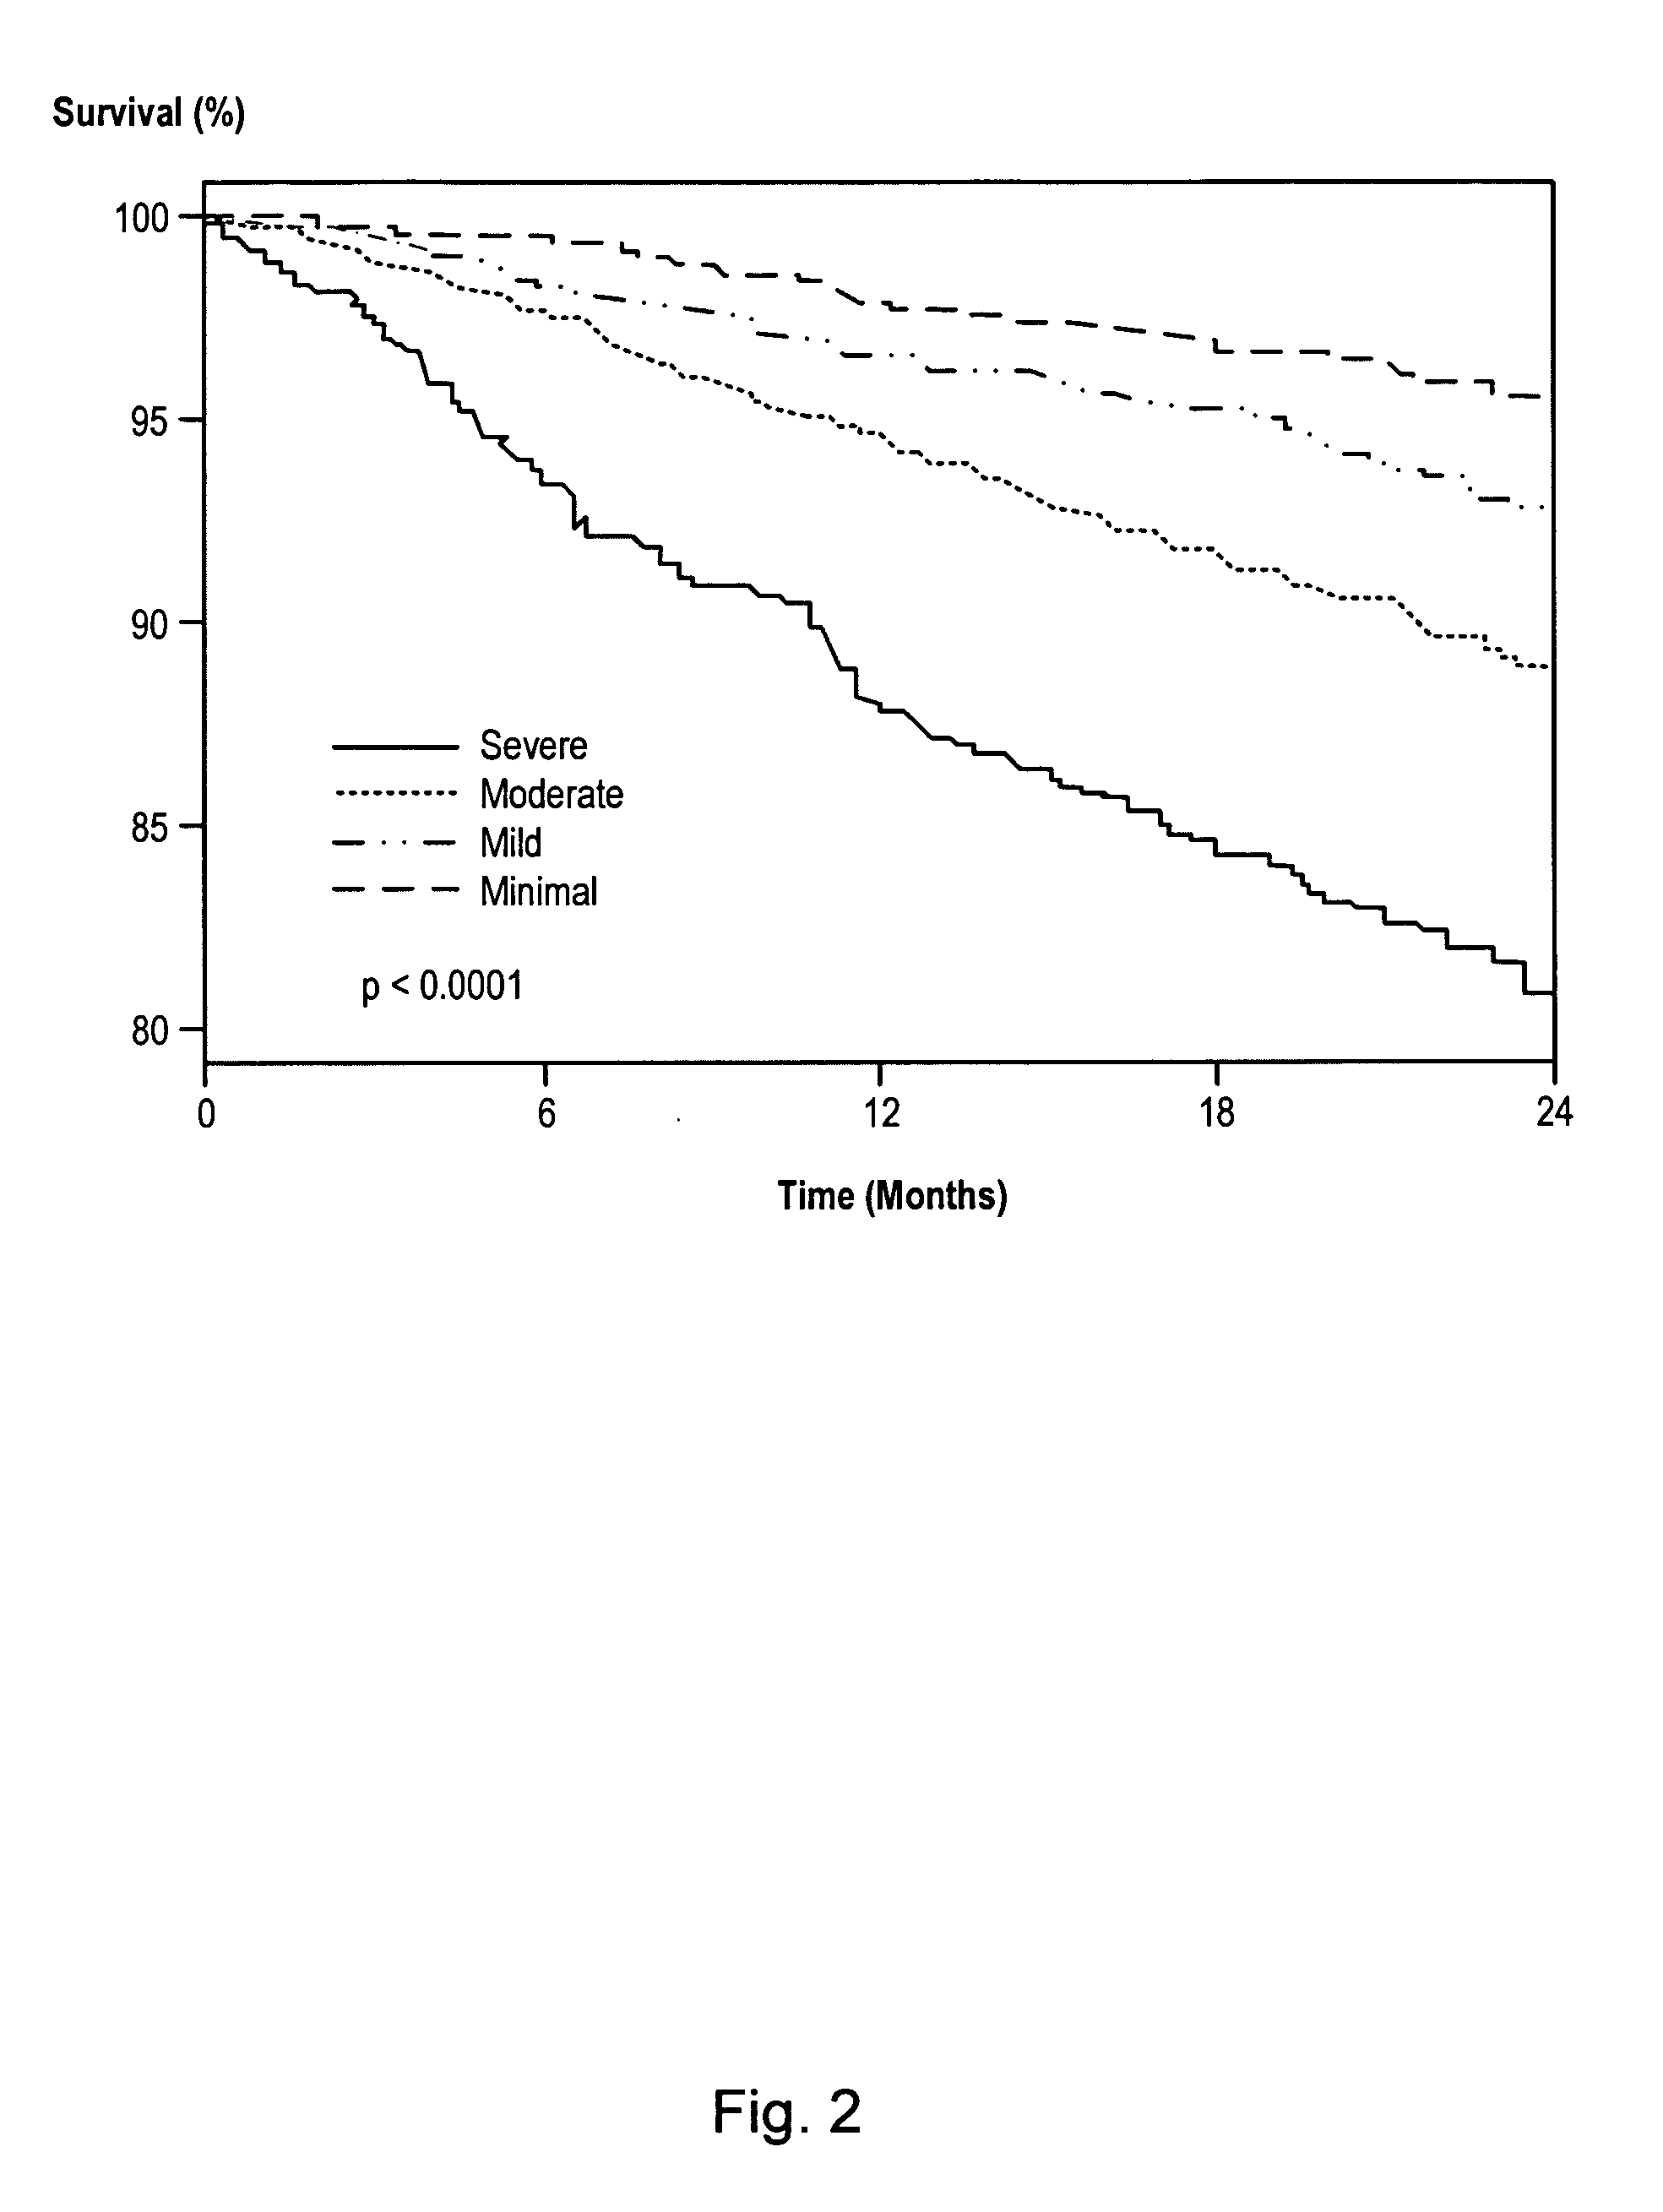
[0124] The data collected in Example 1 was subjected to statistical processing, e.g., as generally shown in steps 110 and 112 of FIG. 1 to create a model relating the respective adverse outcomes to scores on the SAQ. All analyses were performed using commercially available statistical computer programs, namely, SAS™ Version 6.12 (a trademark of SAS Institute, Inc. of Cary, N.C.) and S-Plus 2000™ for Windows (a trademark of Statistical Sciences, Inc., of Seattle, Wash.). Statistical curves for all cause mortality were calculated using Kaplan-Meier analysis. The data were stratified by quartiles of the initial or baseline SAQ scores. Log-rank tests were used to compare data from the respective groups to establish that patients with lower scores initially died sooner and more frequently than patients reporting higher scores. Predictive models were developed for one year mortality and ACS hospitalization, by logistic regression.

[012...

example 3

Univariate Calculation Results

[0128] The results of statistical calculations in Example 2 were inverted to provide a model for prognostic use. Table 1 provides the baseline characteristics and univariate odds ratios for one-year mortality and hospitalization. The mean SF-36 PCS was 30.8±10.5, indicating that these patients scored almost two standard deviations below the mean United States population in terms of general physical health status. Over the one year of observation, there were 238 deaths (5.3% of the test population) and 154 ACS hospital admissions (3.6% of the test population).

[0129] Table 1 describes the relative odds of death at one year by demographic characteristics, comorbidities, and SAQ scores. The most powerful predictive parameters were age, presence of congestive heart failure, and health status. In Table 1, the “Odds Ratio” for “One-Year Mortality” is calculated as the actual mortality divided by the “Minimal” mortality. The low p-values show that the reporte...


PUM


Abstract

A statistical processing system includes a server operably configured with program instructions implementing a plurality of statistical models to at least one of (a) predict a health outcome based on questionnaire responses, (b) assist a patient's choice of therapeutic modality based on questionnaire responses, and (c) assess a health risk or status based on questionnaire responses. Also provided is a research agency communicating with the server and contracted to provide the statistical models using a visual interface communicated by the server. The server is configured to analyze requests received from users relating to a plurality of said statistical models to reduce redundancy in requests for patient data.

Description

CROSS REFERENCE TO RELATED APPLICATIONS [0001] This application claims benefit of priority to provisional patent application Ser. No. 60 / 550,763 filed Mar. 5, 2004, and to provisional patent application Ser. No. 60 / 554,700, filed Mar. 19, 2004, both of which are hereby incorporated by reference in their entirety.BACKGROUND OF THE INVENTION [0002] The invention relates to methods and systems that provide computerized health care management, and more specifically, to methods and systems providing statistical assessment and prognostic information for individuals. [0003] This application hereby incorporates by reference in its entirety another application filed on even date by the same inventors as Attorney Docket No. 23033-2 and entitled “Methods and Apparatus for Providing Decision Support.”[0004] The past decade of health services research has witnessed an explosion of prognostic models to help physicians understand the risks and benefits of proposed medical therapies. However, the a...

Claims


Application Information

Patent Timeline
IPC IPC(8): G06Q40/00
CPCG06F19/3431G06F19/3437G06F19/3443G06F19/3487G06N5/02G06Q40/08G06Q50/22G06Q50/24G06F19/363G16H10/20G16H15/00G16H40/67G16H50/30G16H50/50G16H50/70
Inventor SOTO, GABRIEL ENRIQUESPERTUS, JOHN ALBERT
Owner TERUMO MEDICAL CORP
Why Eureka
Try Eureka