Detection of subsurface resistivity contrasts with application to location of fluids

a technology of resistivity contrast and subsurface, applied in the field of mapping subsurface resistivity contrast, can solve the problems of not being able to input an exact square wave, not being able to recognise the importance of measuring system response, and putting a lot of effor

Inactive Publication Date: 2005-10-27
WRIGHT DAVID +2
View PDF10 Cites 50 Cited by
  • Summary
  • Abstract
  • Description
  • Claims
  • Application Information

AI Technical Summary

Problems solved by technology

TDEM methods all fail to recognise the importance of measuring the system response and instead put much effort into generating a transient signal with as small a turn-off time or ramp turn-off time as possible.
In reality it is not possible to input an exact square wave either.
This is impossible to obtain without a deconvolution of the measured data which is stated to be inherently unstable [5].
 The LOTEM method fails to recognise the importance of measuring the system response for each source transient in the field, and fails to recognise that the decay curves are a function of all the intervening material between the source and corresponding receiver where the induced currents flow.
 Their technique fails to recognise the importance of measuring the system response for each source transient and using this to deconvolve the measured transients to obtain the estimated earth impulse response functions.

Method used


Image

  • Detection of subsurface resistivity contrasts with application to location of fluids
  • Detection of subsurface resistivity contrasts with application to location of fluids
  • Detection of subsurface resistivity contrasts with application to location of fluids

Examples


Embodiment Construction

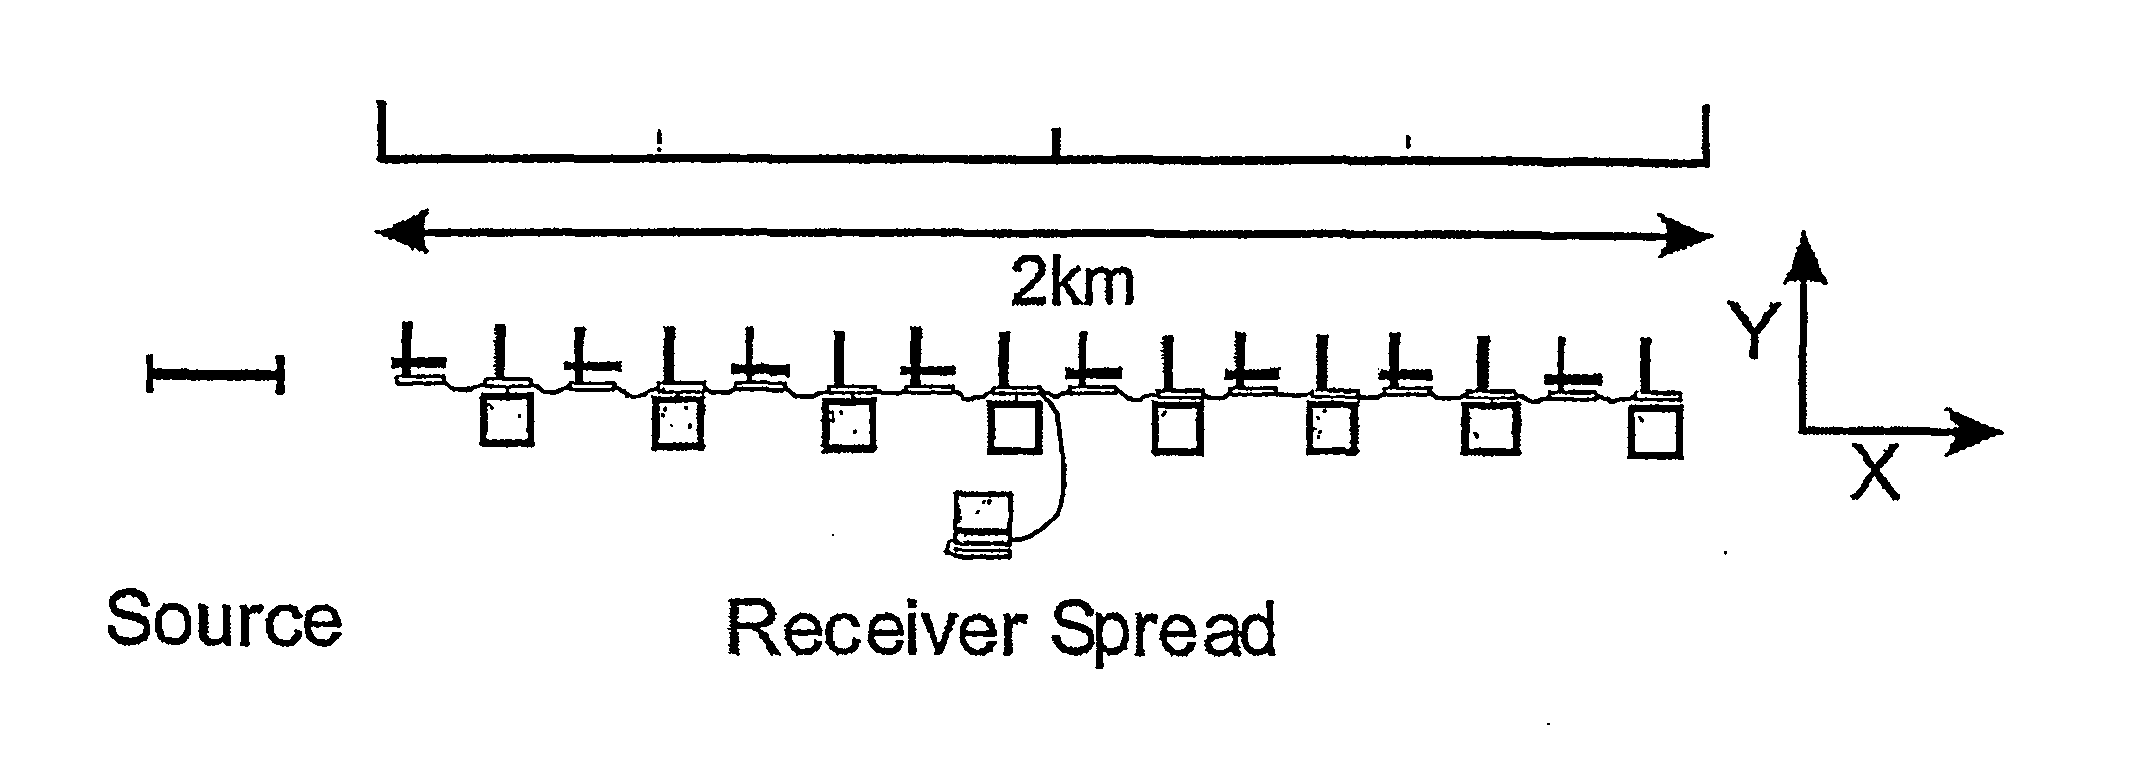
[0049] Multichannel Transient ElectroMagnetic (MTEM) data can be acquired in a number of different ways. By way of example only, there is described below elements of the data acquisition system, as used in the THERMIE project OG / 0305 / 92 / NL-UK, and as described in [14] above. FIG. 1 shows a typical configuration of a source and a line of receivers. The source is a current in a wire grounded at each end; in this case the two ends are 250 m apart. The receivers are represented as boxes in FIG. 1, each with two channels, and are spread out over a line 2 km long, which, in this case, is in line with the source. The receivers measure two kinds of electromagnetic response: potential differences, and the rate of change of the magnetic field. Potential differences are measured between two grounded electrodes, typically 125 m apart, while the rate of change of the magnetic field is measured with loops of wire, typically 50 m by 50 m square loops with many turns. FIG. 1 shows thirty-two receiv...


PUM


Abstract

The invention relates to a method of mapping subsurface resistivity contrasts by making multichannel transient electromagnetic (MTEM) measurements on or near the earth's surface using at least one source, receiving means for measuring the system response and at least one receiver for measuring the resultant earth response. All signals from the or each source-receiver pair are processed to recover the corresponding electromagnetic impulse response of the earth and such impulse responses, or any transformation of such impulse responses, are displayed to create a subsurface representation of resistivity contrasts. The invention enables subsurface fluid deposits to be located and identified and the movement of such fluids to be monitored.

Description

PRIORITY APPLICATION [0001] The present application is a continuation of co-pending U.S. patent application Ser. No. 10 / 482,554 filed Jun. 17, 2004, which is a 371 filing of International Patent Application No. PCT / GB02 / 04121, which was filed on Sep. 9, 2002, which claims priority to U.K. Patent Application No. 0121719.9, which was filed on Sep. 7, 2001. Each of the foregoing applications is hereby incorporated by reference.TECHNICAL FIELD [0002] This invention relates to a method of mapping subsurface resistivity contrasts. The method enables the detection and location of subsurface resistivity contrasts, which, in turn, enables the discrimination between, for example, water (brine or fresh water), which is conductive, and hydrocarbons (gas or oil), which are resistive. [0003] Porous rocks are saturated with fluids. The fluids may be water (brine or fresh water), or hydrocarbons (gas or oil). The resistivity of rocks saturated with hydrocarbons is often orders of magnitude greater ...

Claims


Application Information

Patent Timeline
Patent Type & Authority Applications(United States)
IPC IPC(8): G01V3/02
CPCG01V3/02
Inventor WRIGHT, DAVIDZIOLKOWSKI, ANTONIHOBBS, BRUCE
Owner WRIGHT DAVID
Why Eureka
Try Eureka