Methods and devices to guide therapy for ventricular fibrillation based on waveform analysis and survival benefit analysis

a waveform analysis and waveform technology, applied in bioelectric signal measurement, medical science, diagnostics, etc., can solve the problems of no longer seen scaling regions and high sampling rate, and achieve the effect of high separation

Inactive Publication Date: 2005-11-03
SHERMAN LAWRENCE DUANE
View PDF3 Cites 36 Cited by
  • Summary
  • Abstract
  • Description
  • Claims
  • Application Information

AI Technical Summary

Benefits of technology

[0020] Still further objects and advantages will become apparent from a consideration of the ensuing descriptions and drawings.
[0021] In general, the present invention provides a new quantitative measure of the heart rhythm waveform, and particularly, the ventricular fibrillation waveform, related to the quotient of the summed power in two bands of the frequency power spectrum of the ECG waveform as derived from Fourier transformation of the ECG waveform. The quotient of a summation of a high frequency power band and of the summation of the power in a low frequency power band can be calculated from a short interval of a ventricular fibrillation waveform. In studies of the present invention 5 second intervals of waveform were analyzed in less than one second.
[0022] Fourier analysis methods involve transforming the time series of data points into the various frequencies of sine and cosine waves which constitute it. The Fourier transform produces a series of amplitudes for each frequency which indicate the proportion or amplitude of that particular frequency of sine or cosine wave which is present in the original signal. It is then possible to recreate the original signal from the frequencies by combining pure sine or cosine waves of each frequency at the amplitude for that frequency as indicated by the transform. When these individual waves are combined in additive fashion, the original signal is seen to have been recreated. The power in the signal at each frequency is defined to be the product of the complex number representing the amplitude of that frequency as produced by the Fourier transform times its complex conjugate. Then, the series of such values representing the power at each frequency present in the transformed signal is called the power spectrum.
[0023] The Life Ratio (LR) is based on taking the discrete Fourier transform of a 5 second segment of VF and then calculating its power spectrum by multiplying the complex value at each frequency by its complex conjugate to obtain the power at th...

Problems solved by technology

Unfortunately, when applied to data obtained at recording rates of 125 samples/second and with low pass filtering below 60 Hz characteristic of currently used defibrillators, the scaling regions are no lo...

Method used


Image

  • Methods and devices to guide therapy for ventricular fibrillation based on waveform analysis and survival benefit analysis
  • Methods and devices to guide therapy for ventricular fibrillation based on waveform analysis and survival benefit analysis
  • Methods and devices to guide therapy for ventricular fibrillation based on waveform analysis and survival benefit analysis

Examples


Embodiment Construction

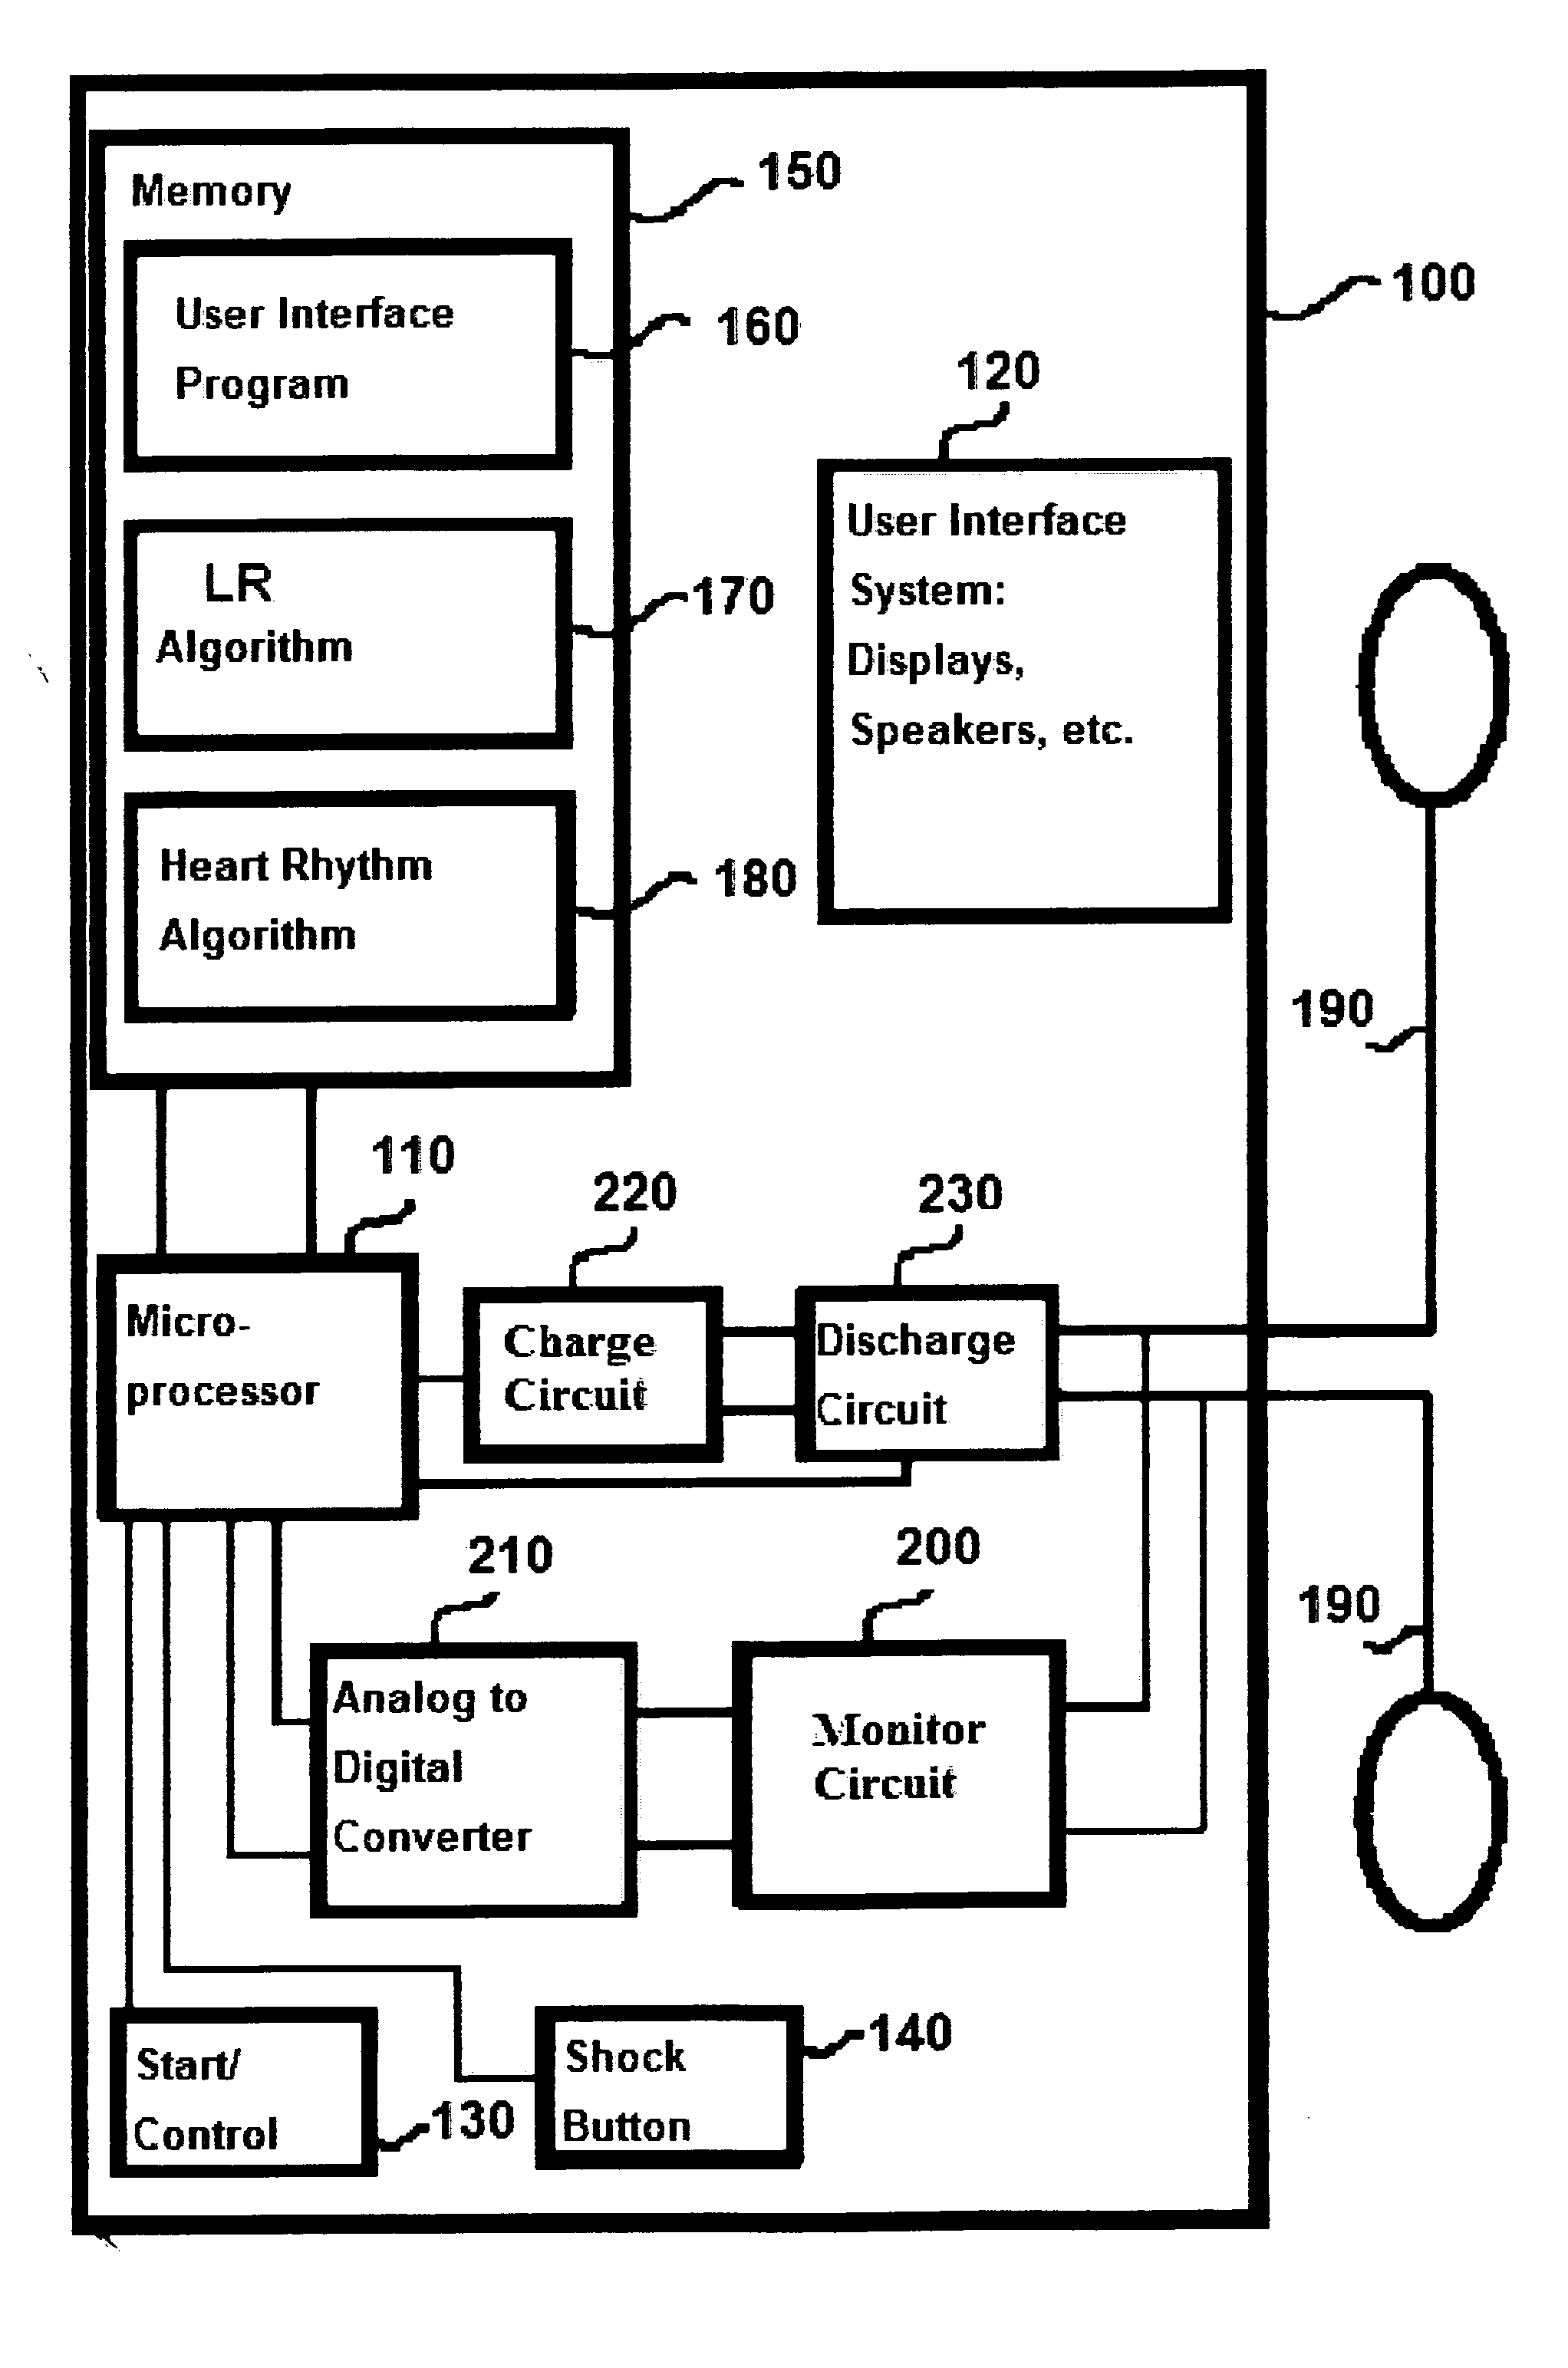
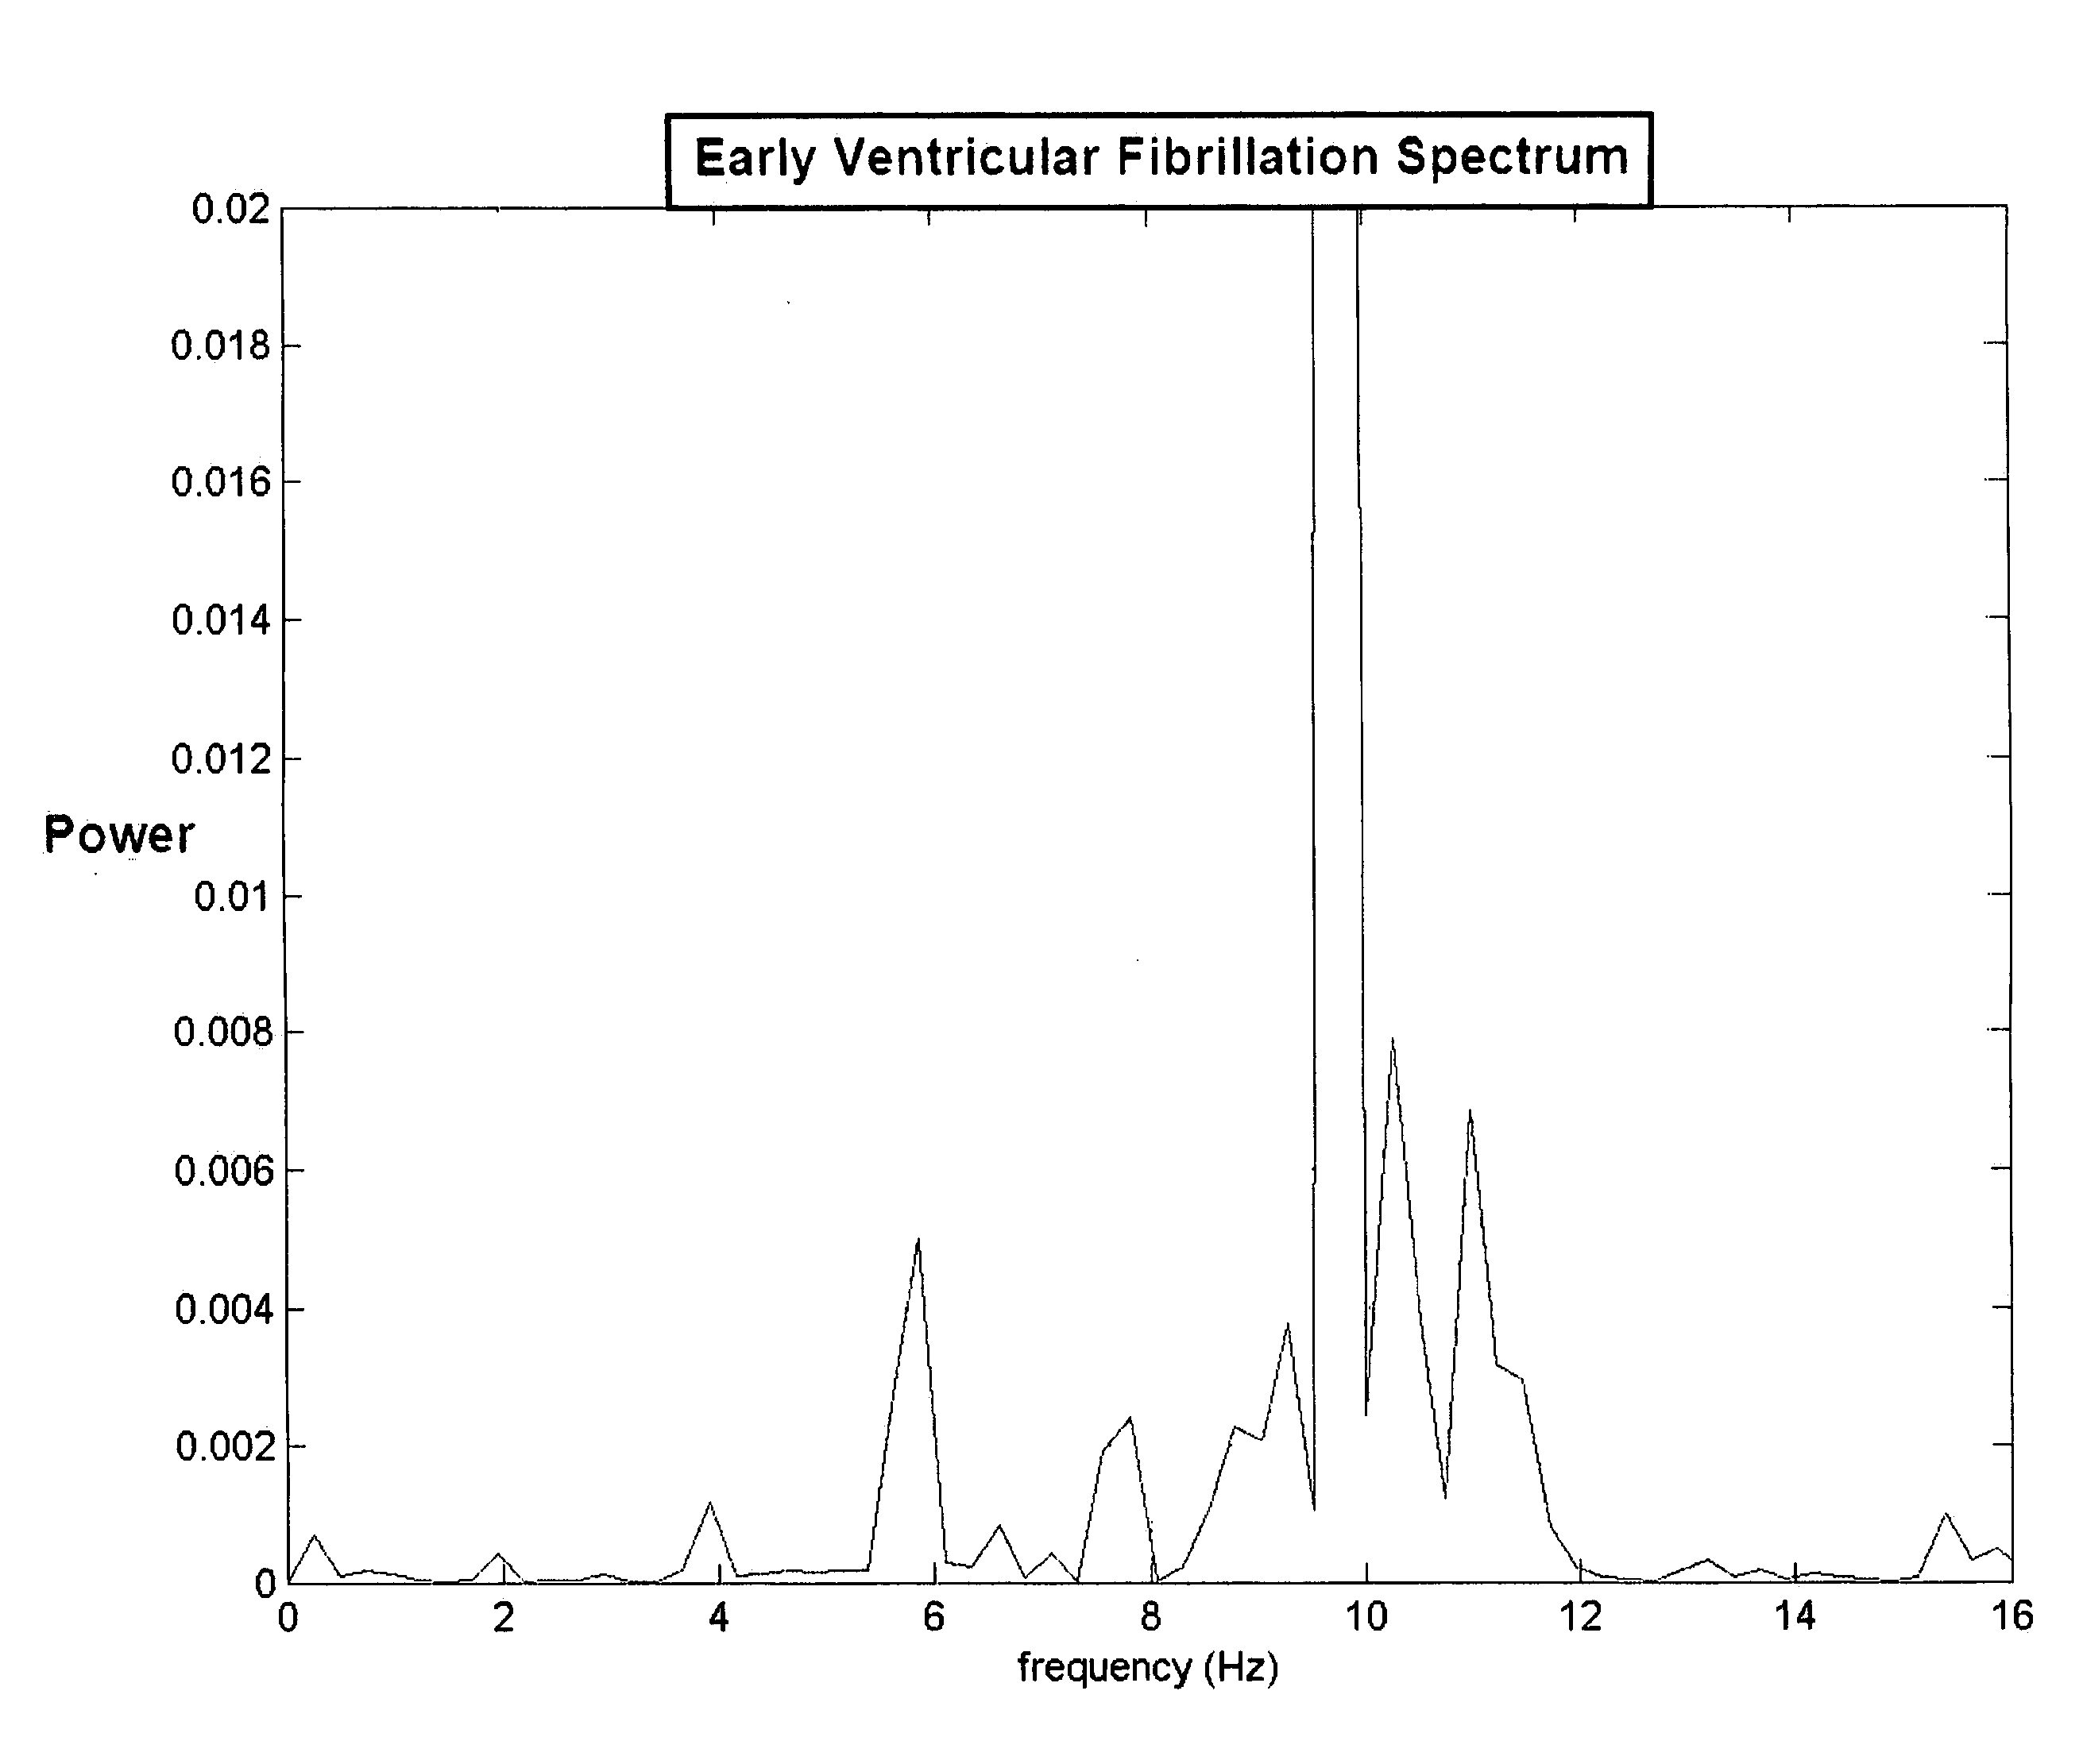
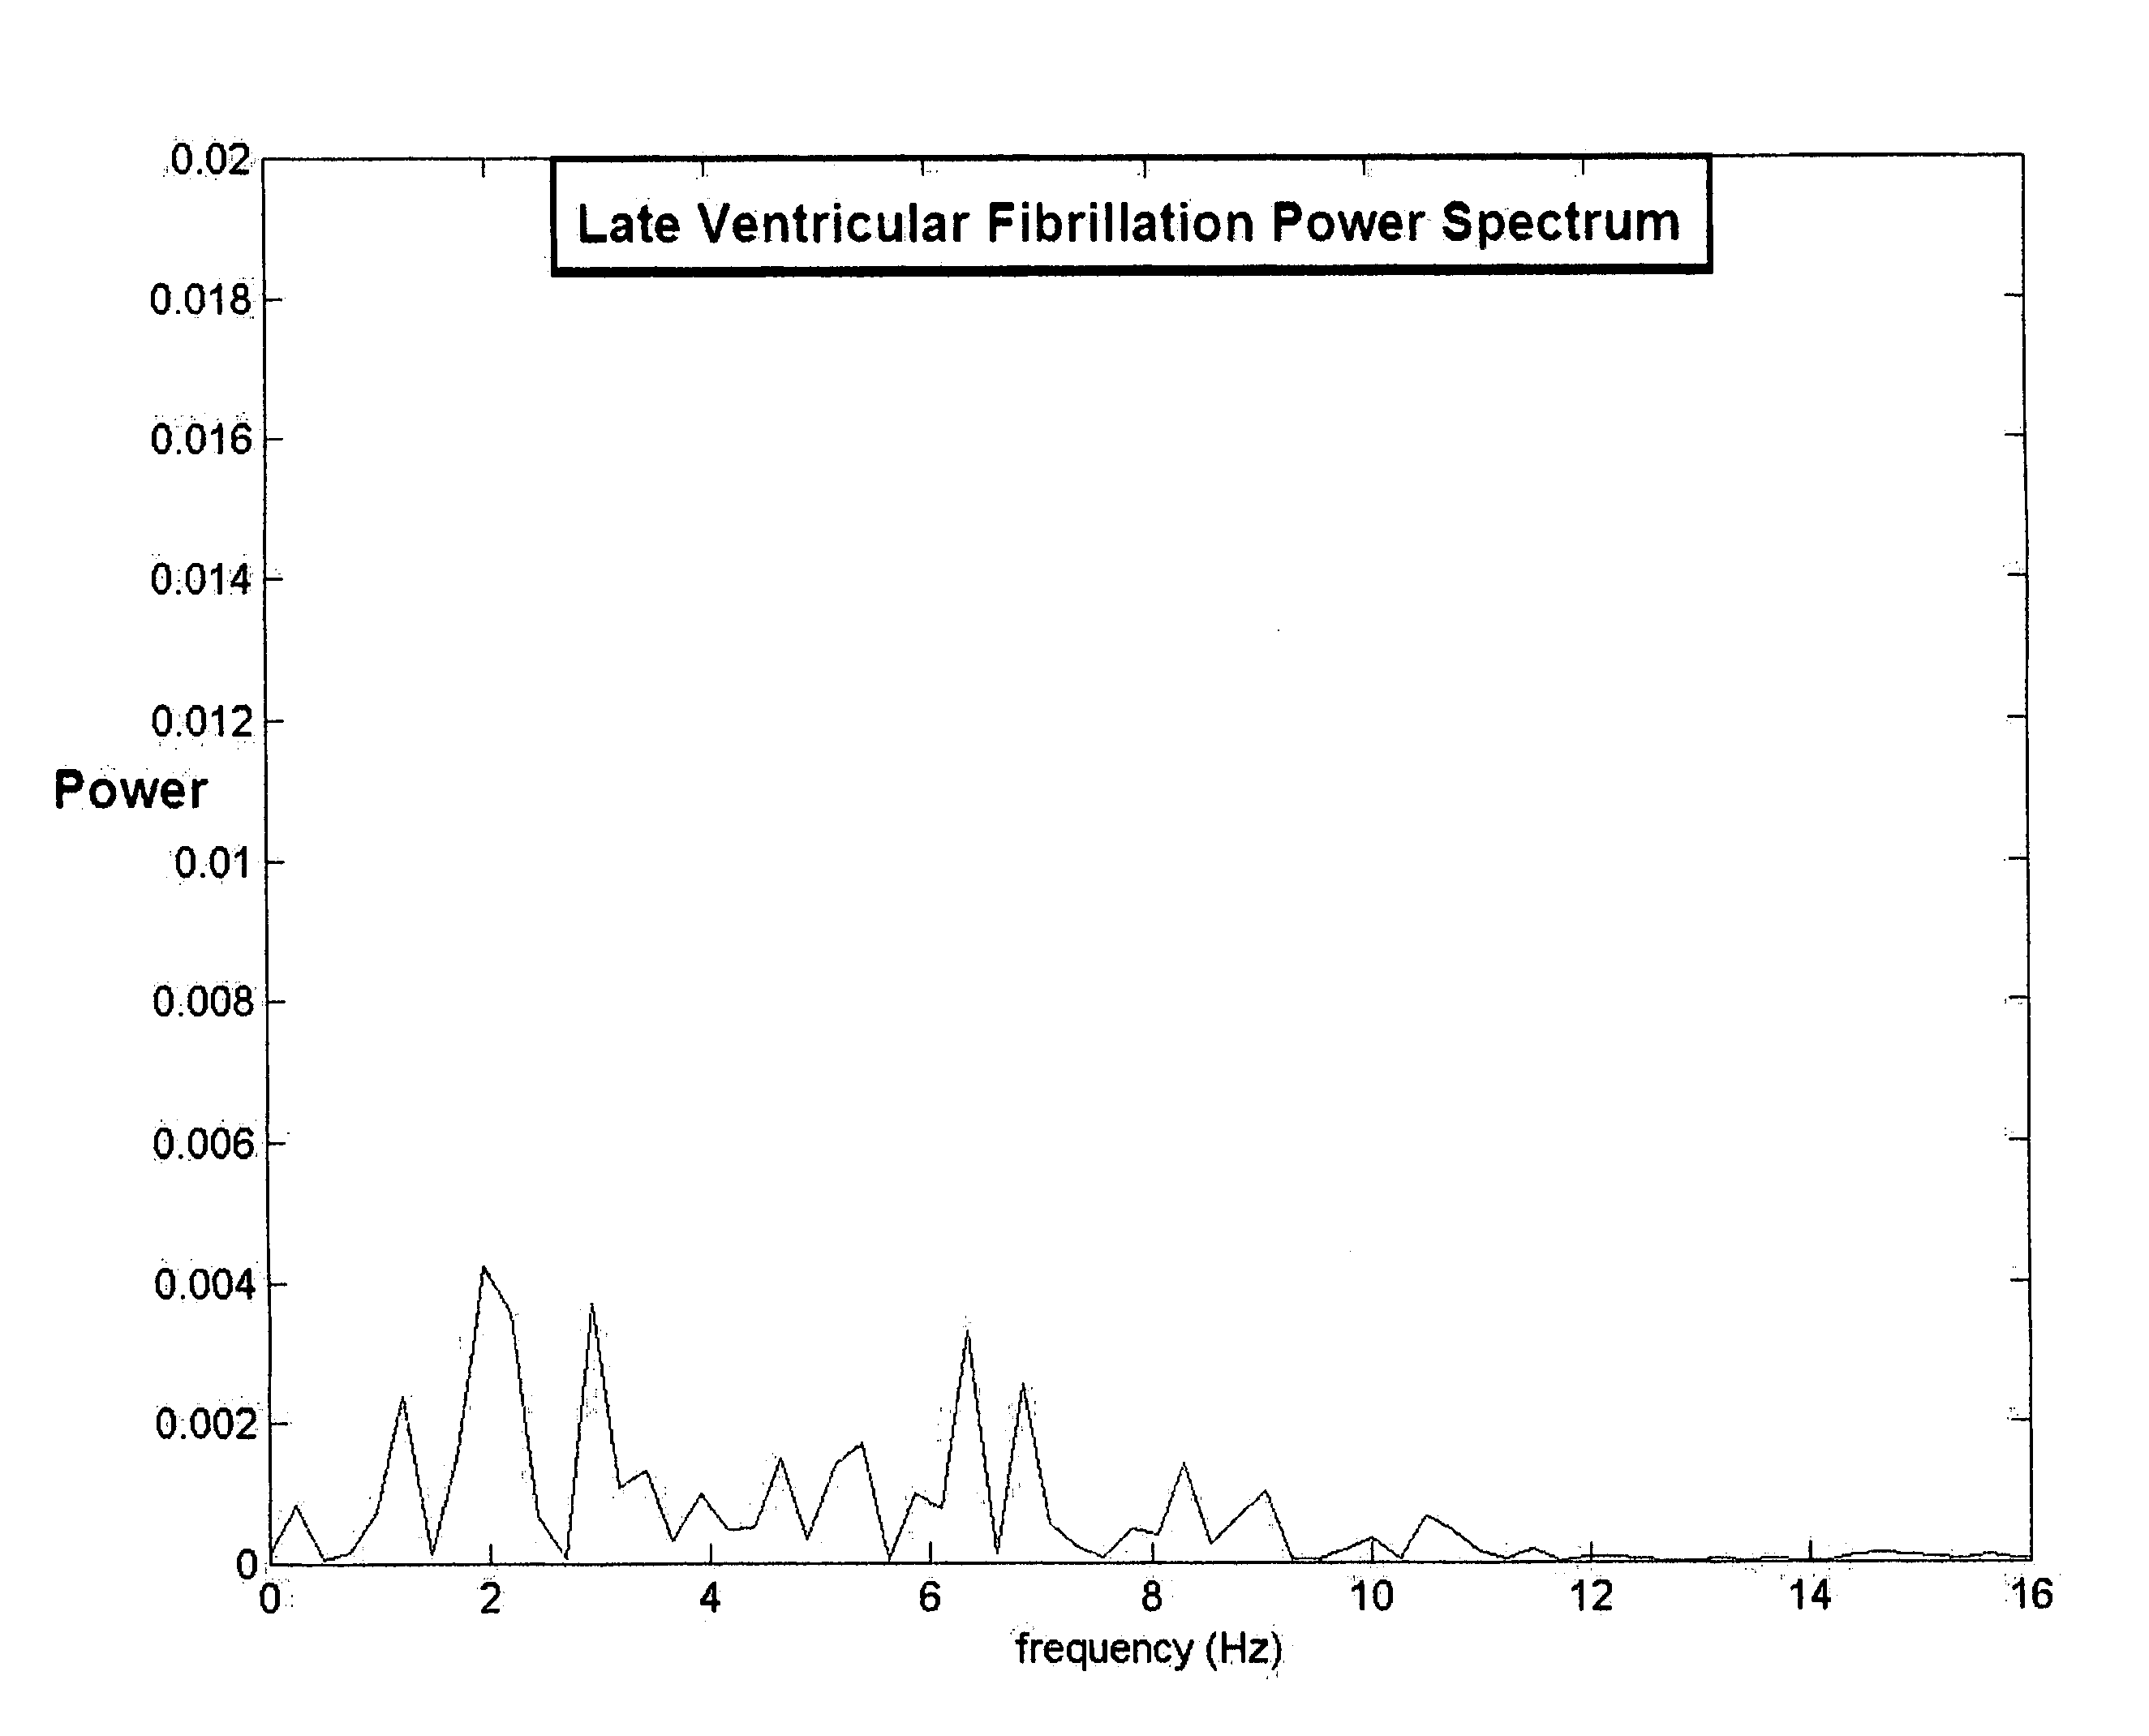
[0056] In studies of the present invention, the ability of the LR (alone or in combination with the LAC) to predict or determine a state, phase or class of ventricular fibrillation as modeled by the duration of ventricular fibrillation was determined. Preliminary study of the frequency power spectrum produced through Fourier analysis of segments of early and late VF demonstrated that there are commonly two or more peaks in the power spectrum of early VF (FIG. 1). In early VF one or more large peaks are often seen above 8 Hz and one or more smaller peaks below 8 Hz. In late or prolonged VF the pattern changes to show several peaks below 8 Hz which are larger in total area than any peaks which may be present above 8 Hz (FIG. 2). In addition, the peaks were prominent with high amplitude in early VF, but tended to broaden and have lower amplitude with almost no power above 8 Hz at later times (FIG. 3). In order to take advantage of these observations, a technique to measure specific “fr...


PUM


Abstract

A method of determining a state of ventricular fibrillation from a waveform, includes: performing calculations on the Fourier transform of the waveform voltage values by using the quotient of the power in a high frequency band and of the power in a low frequency band; and determining the state of ventricular fibrillation by relating this ratio to the state of ventricular fibrillation. A defibrillation system for use in treatment of ventricular fibrillation includes at least one sensor to measure heart rhythm and at least one applicator to apply a defibrillation shock to a patient. The system further includes at least one processor which is adapted to calculate the ratio and also to obtain user input regarding survival of subgroups and average response times in the user's domain which allows calculation of an estimated maximum overall survival and selection of an optimum threshold for the ratio measure based on this maximum. The system further includes a user interface system in operative connection with the processor to provide information related to the ratio to a user.

Description

CROSS-REFERENCE TO RELATED APPLICATIONS [0001] This application uses the Logarithm of the Absolute Correlations for which I made Provisional Patent Application Ser. No. 60 / 521,465, filed Apr. 30, 2004,FEDERALLY SPONSORED RESEARCH [0002] Not Applicable SEQUENCE LISTING OR PROGRAM The computer code involved in the LR calculations is incorporated into application at end of DETAILED DESCRIPTION OF INVENTION section of this application. BACKGROUND OF THE INVENTION [0003] 1. Field of the Invention [0004] The present invention is directed to methods, systems and devices for the characterization of cardiac rhythms and, particularly, characterization of ventricular fibrillation and to methods, systems and devices to be used in the treatment of ventricular fibrillation based upon the characterization of ventricular fibrillation. [0005] References set forth herein may facilitate understanding of the present invention or the background of the present invention. Inclusion of a reference herein ...

Claims


Application Information

Patent Timeline
IPC IPC(8): A61B5/361A61N1/39
CPCA61B5/046A61N1/3925A61B5/7257A61N1/3904A61N1/39044A61B5/361
Inventor SHERMAN, LAWRENCE DUANE
Owner SHERMAN LAWRENCE DUANE
Why Eureka
Try Eureka