Temporal visualization algorithm for recognizing and optimizing organizational structure

a technology of organizational structure and visualization algorithm, applied in the direction of instruments, computing, electric digital data processing, etc., can solve the problems of user excessive time and resources, difficult to harness and evaluate the products produced through swarm, and relationships that go unnoticed, so as to improve resource arrangement and improve resource grouping efficiency.

Inactive Publication Date: 2006-04-06
IQUEST GLOBAL CONSULTING
View PDF4 Cites 75 Cited by
  • Summary
  • Abstract
  • Description
  • Claims
  • Application Information

AI Technical Summary

Benefits of technology

[0012] In this regard, the present invention provides a method and system for visualizing interaction patterns between related resource items. As such, the general purpose of the present invention, which will be described subsequently in greater detail, is to provide a method and system for the visual identification and analysis of the dynamics of the interrelationships between identified resources. The system in effect provides both an interactive movie and a static 3-dimensional surface view depicting the interaction between identified resources based on their relative interactions and / or interrelated features thereby identifying and visualizing the underlying organizational network. By comparing dynamic interaction patterns, typical organizational or relational patterns are identified thereby allowing a visual analysis of the resources in a manner that allows improvements in resource arrangement and higher efficiencies in resource groupings.
[0013] Accordingly, the system of the present invention takes as input the interrelationships that are observed as existing between identified resources, and automatically generates interactive movies that depict a visualization of the of the interaction patterns among the identified resources. Each resource is represented as a dot. A line between two dots indicates a relationship. The closer the two dots are placed together, the more intensive is their relationship, that is, the more commonality or interaction those resources share. Further, the most active resources, namely the resources that have the most relational links or lines extending therefrom, are placed in the center of the network. Once the visualization movie has been built, a user can search for groupings of related resources by simply searching for and identifying the various clusters within the network. In this manner, the system of the present invention provides a tool for easy visual identification of related groups of resources.
[0014] Accordingly, it is an object of the present invention to provide a method and system whereby underlying interrelationships between related resources can be identified visually. It is a further object of the present invention to provide a visualization system for identifying interrelationships between various resources in a manner that assists in identifying the relative strengths of each of the interrelationships thereby providing useful information for identifying related resource groups. It is still a further object of the present invention to provide a visualization method for displaying interrelationships between resources that allows efficient grouping of the resources.

Problems solved by technology

The difficulty arises in attempting to harness and evaluate the products produced through swarm intelligence.
Without the ability to automatically identify such relationships, often the relationships go unnoticed or must be identified by analyzing large quantities of information through a manual process.
This type of problem frequently arises in the context of swarm intelligence and collaborative resource pools such as is available on the Internet, where a need exists for a user to access information relevant to their desired search without requiring the user to expend an excessive amount of time and resources searching through all of the available information.
While keyword searching produces fast results, searches based on such methods are typically unreliable, generally collecting a large number of resources that are not particularly relevant to the desired search.
Further, the results are typically provided in a listed fashion that fails to assist a user in identifying the underlying relationships that exist between the various identified results.
However, none of these modified search techniques provide the ability to visualize the underlying interrelationships that may exist between the selected resources.

Method used


Image

  • Temporal visualization algorithm for recognizing and optimizing organizational structure
  • Temporal visualization algorithm for recognizing and optimizing organizational structure
  • Temporal visualization algorithm for recognizing and optimizing organizational structure

Examples


Embodiment Construction

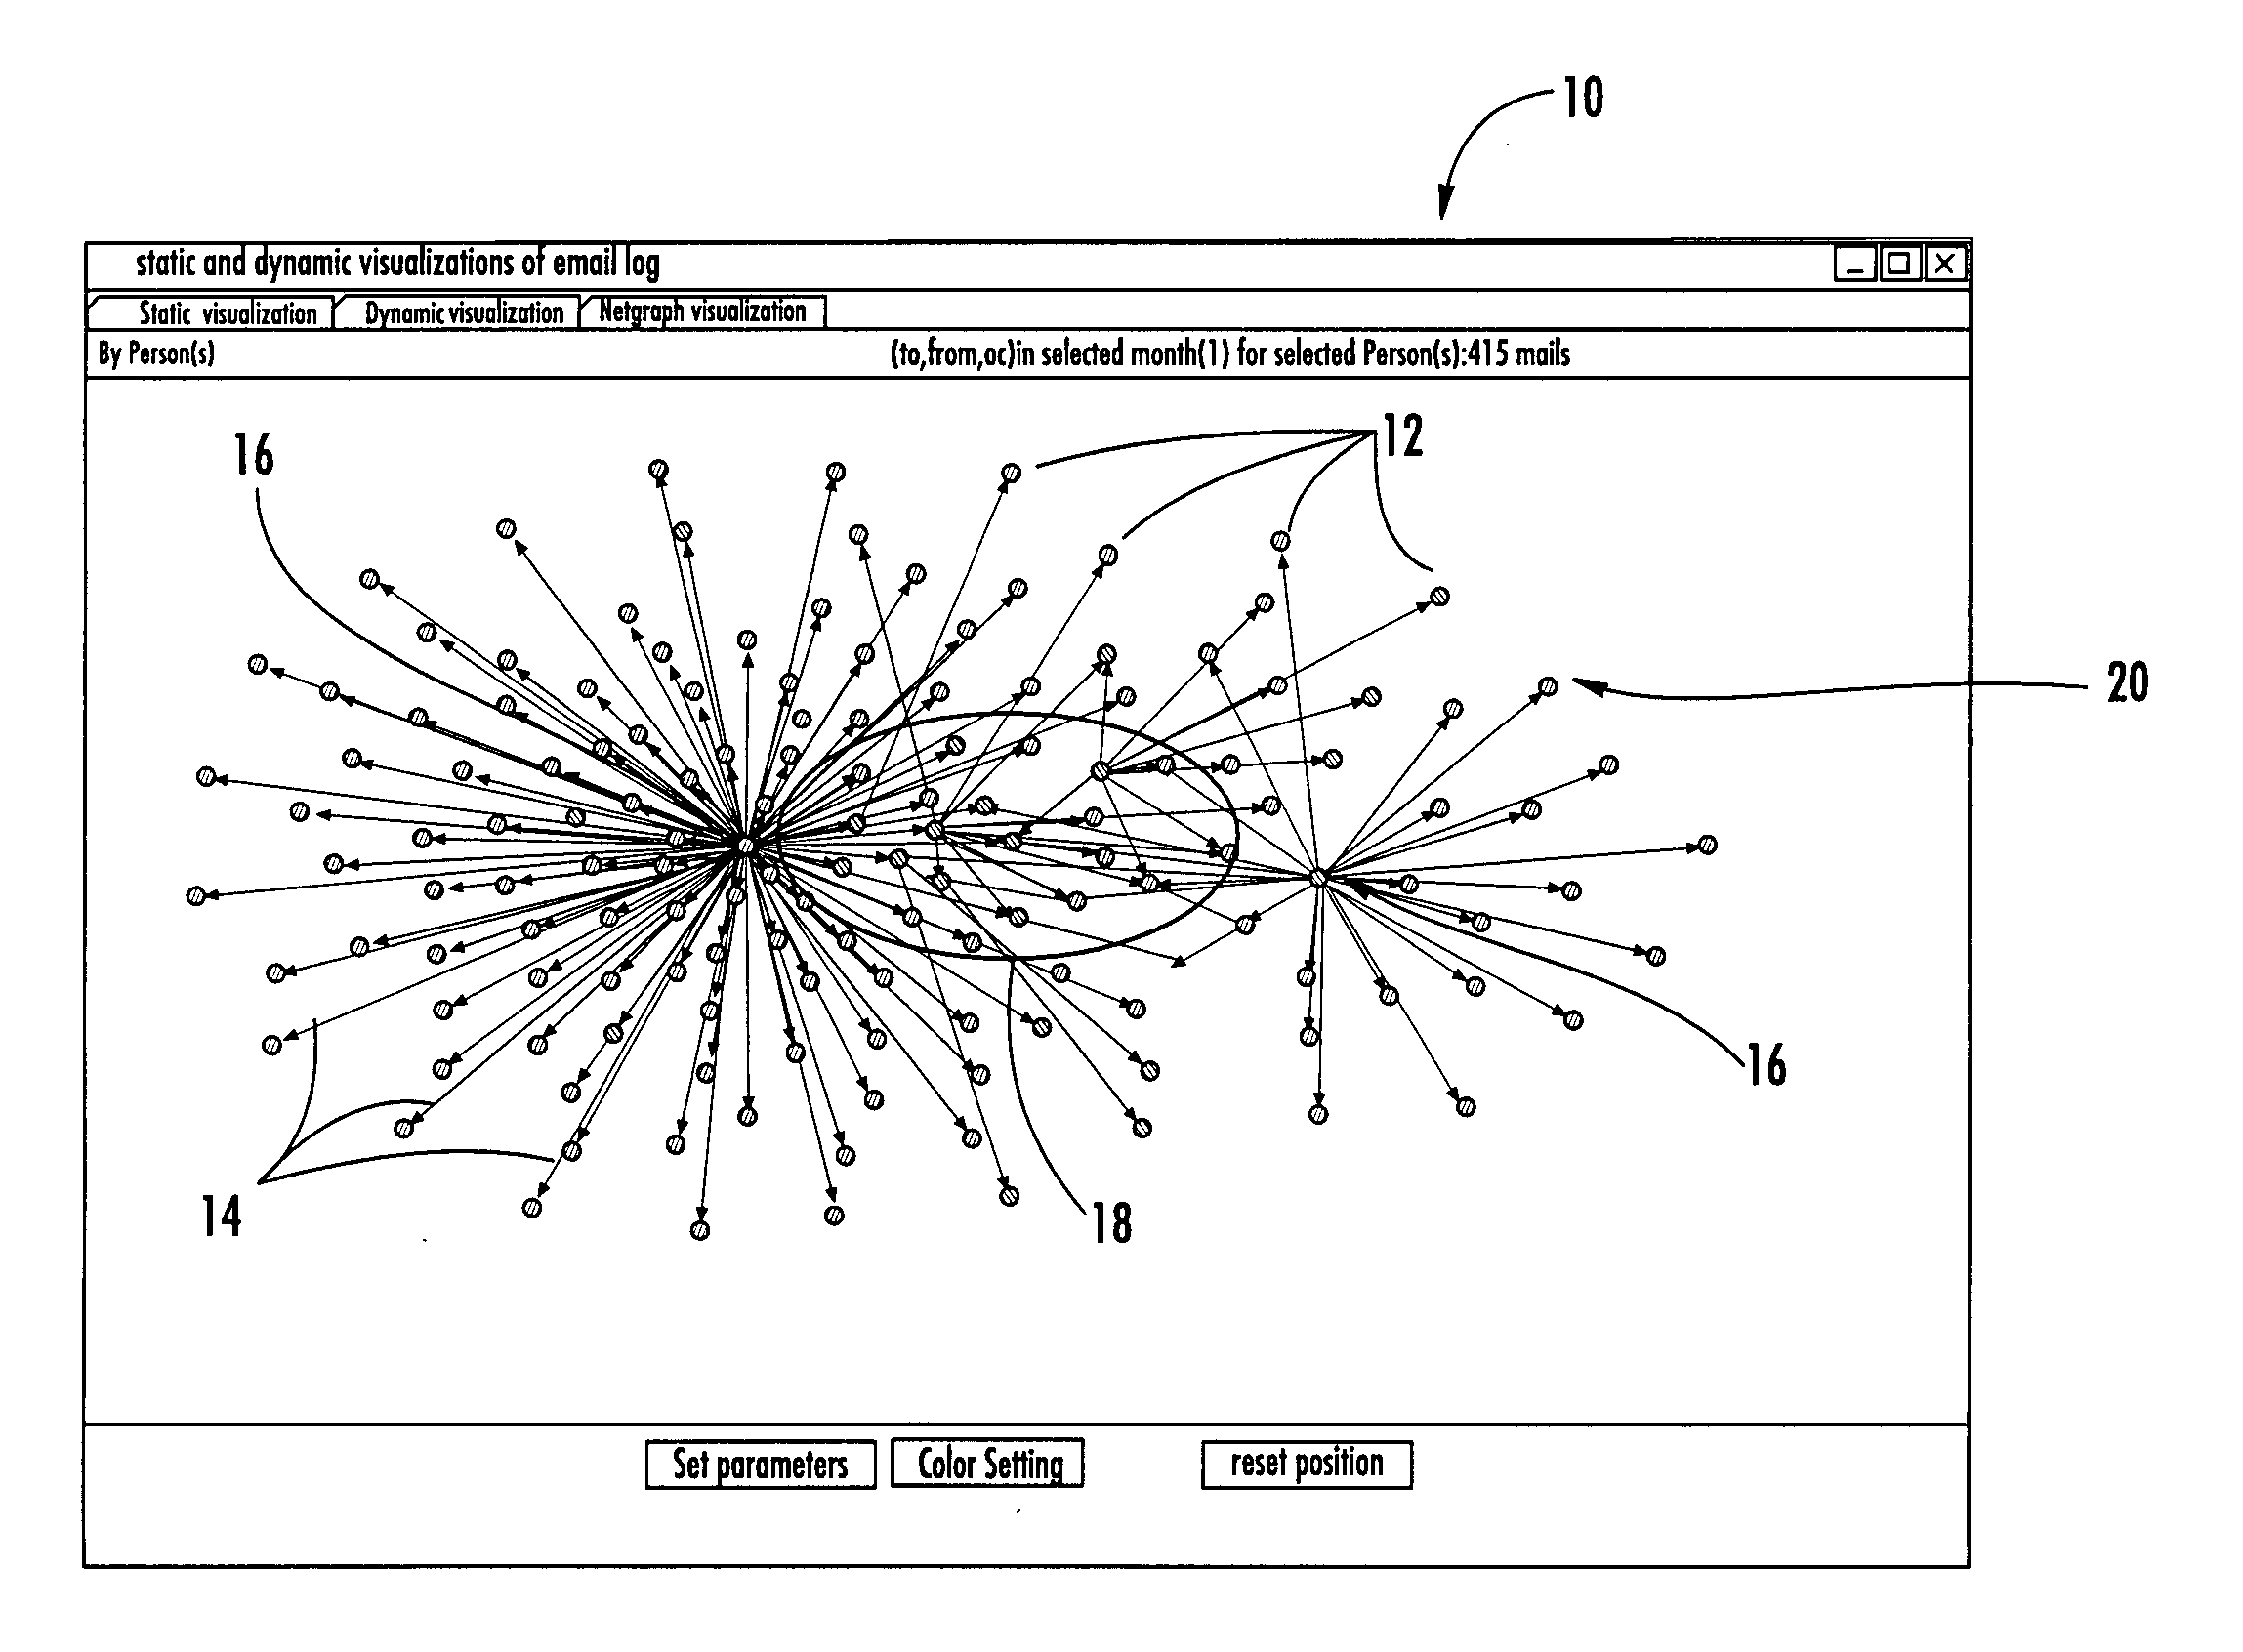
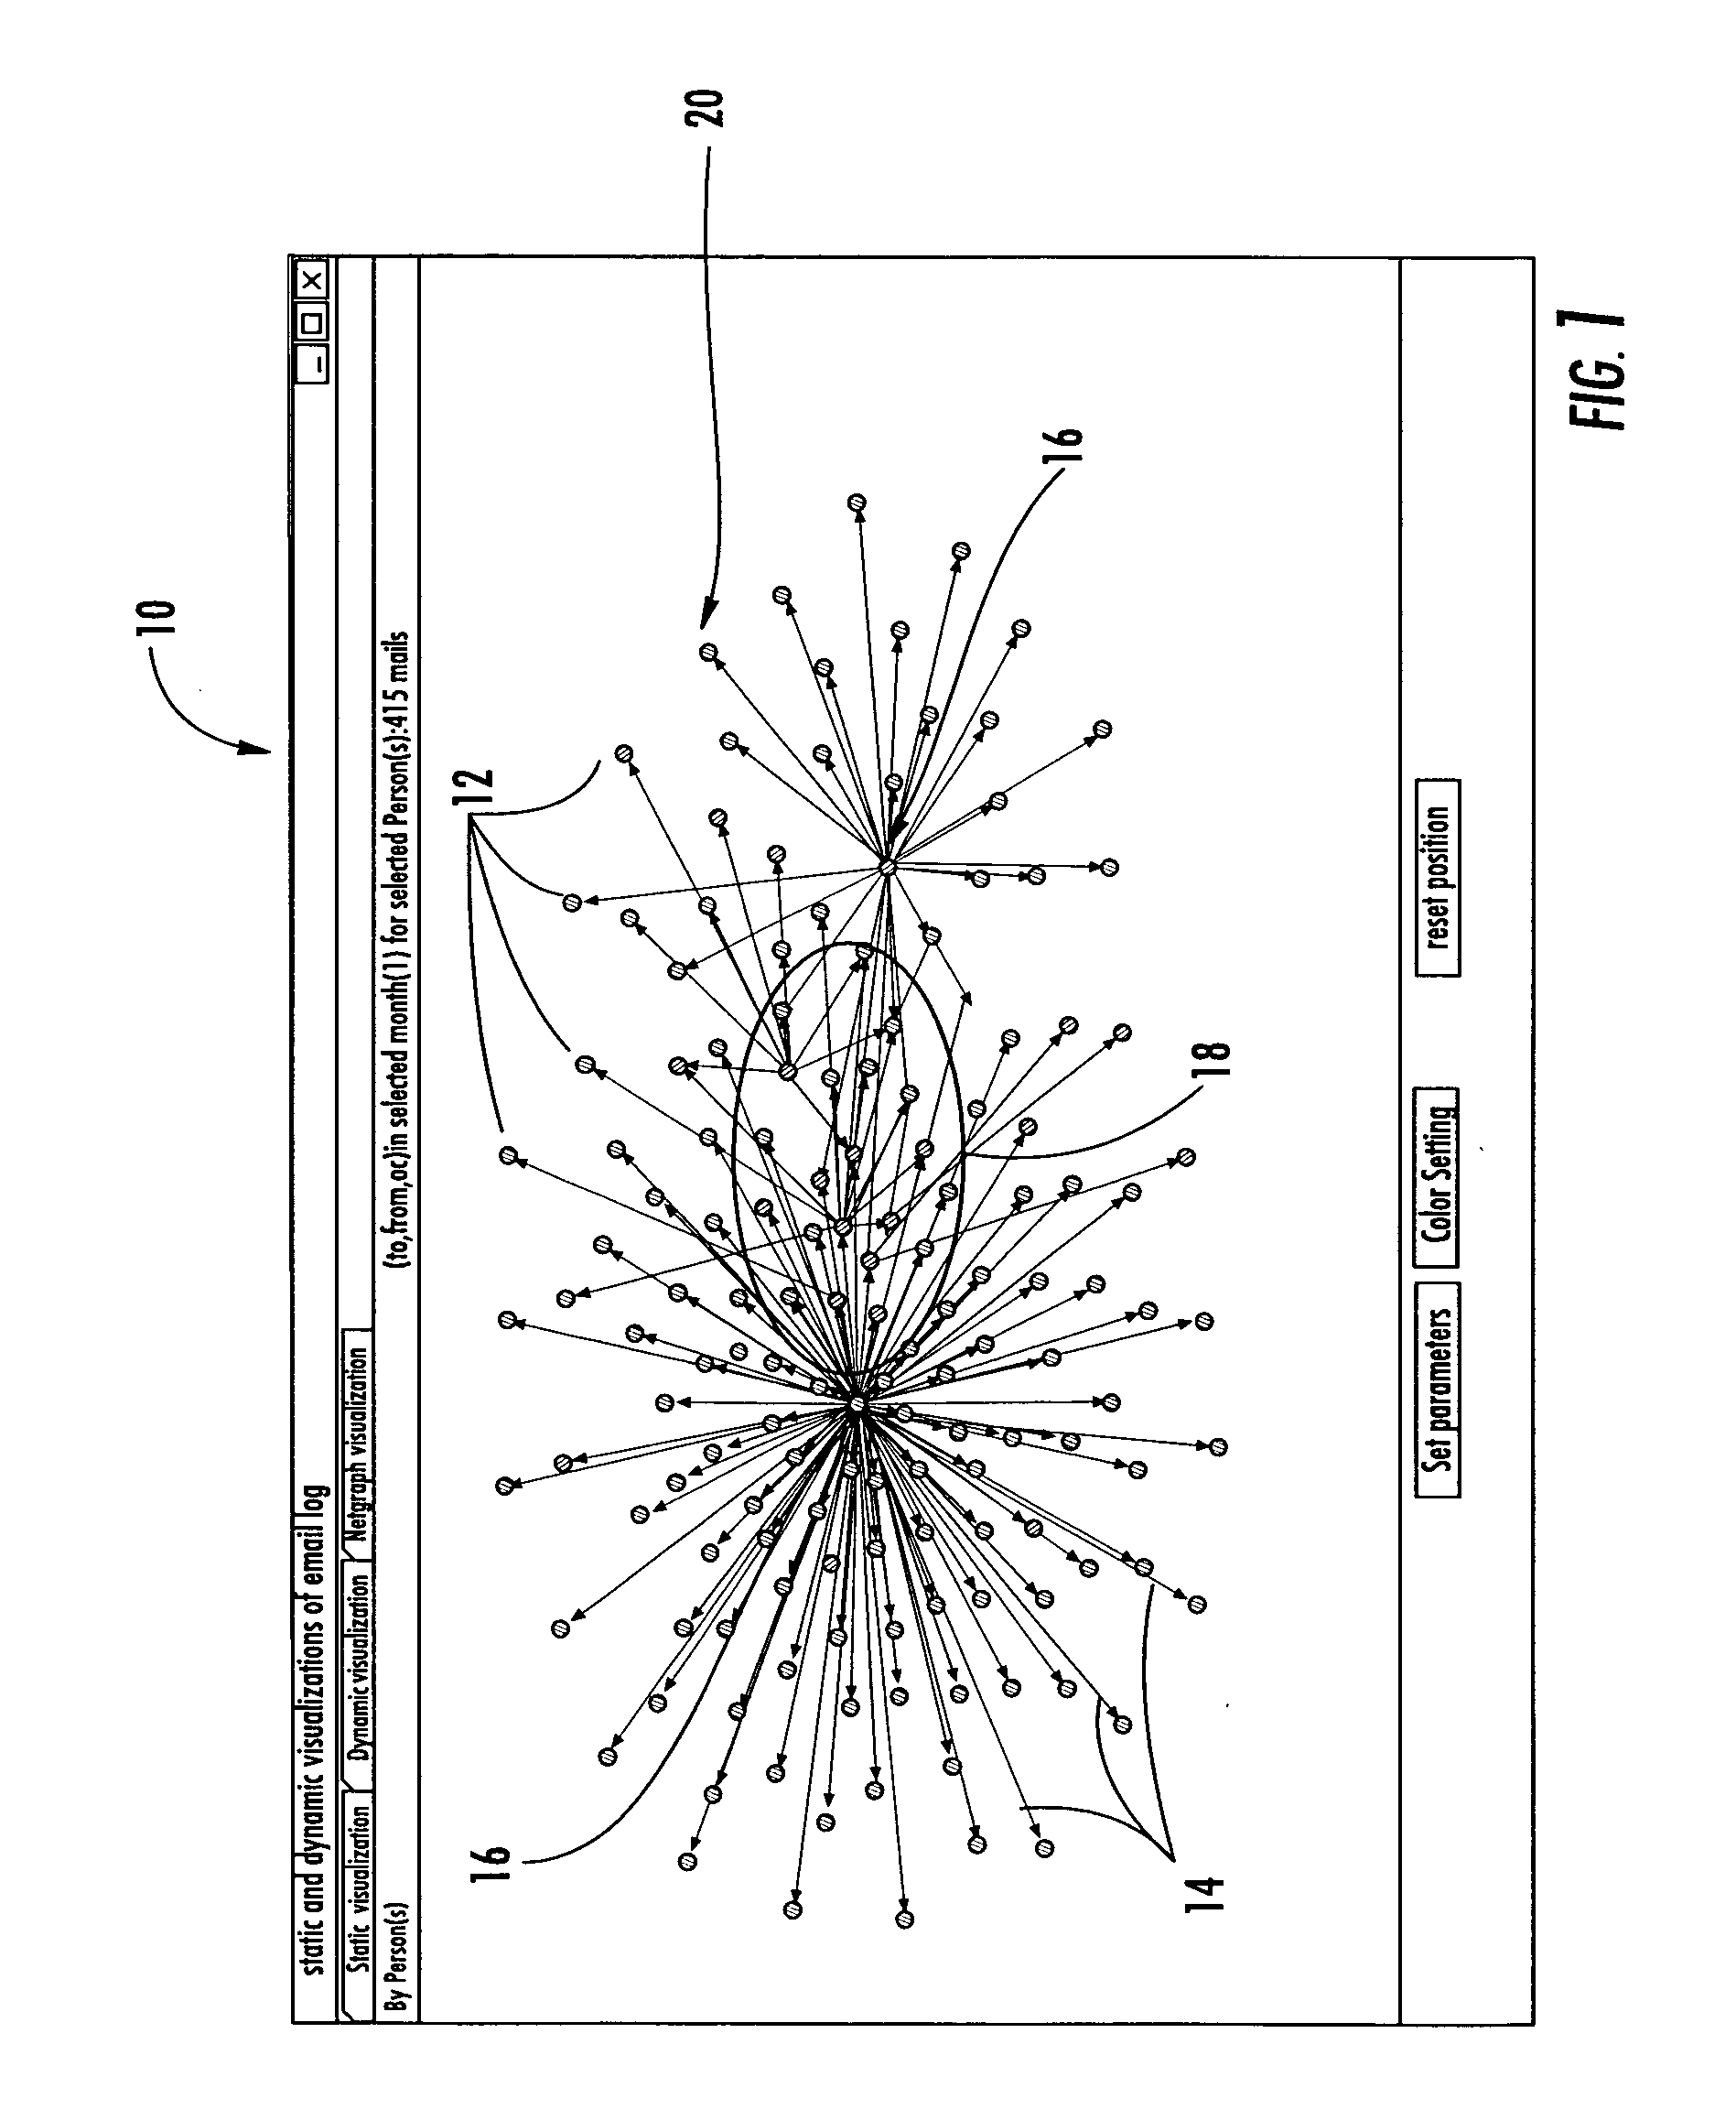
[0023] Now referring to the drawing figures, a representative display 10 of the output from the visualization system of the present invention is shown in FIG. 1 and represents a single snapshot in time. As can be seen, each of the discrete resources 12 is generally depicted as a dot, while a line represents each of the interrelationships 14 between discrete resources 12. The relative placement of the dots representing resources 12 coincides to the relative activity of that resource 12, while the relative length of the line representing the interrelationships 14 coincides to the relative strength of the interrelationship 14 of the connected resources 12. The specifics related to these concepts will be discussed in greater detail below.

[0024] It can be appreciated that in the context of the present invention it is important to note that the term resources 12 is meant to represent a broad range of organizational concepts. While in any given analysis, all of the resources 12 presented ...


PUM


Abstract

A system is provided that takes as input the interrelationships which are observed between identified resources, and automatically generates interactive movies that depict a visualization of the of the interaction patterns among the identified resources. Each resource is represented as a dot. A line between two dots indicates a relationship. The closer the two dots are placed together, the more intensive is their relationship, that is, the more commonality or interaction those resources share. Further, the most active resources, namely the resources that have the most relational links or lines extending therefrom, are placed in the center of the network. Once the visualization movie has been built, a user can search for groupings of related resources by simply searching for and identifying the various clusters within the network.

Description

CROSS-REFERENCE TO RELATED APPLICATIONS [0001] This application is related to and claims priority from earlier filed U.S. Provisional Patent Application No. 60 / 615,536, filed Oct. 1, 2004, the contents of which are incorporated herein by reference.BACKGROUND OF THE INVENTION [0002] The present invention relates generally to efficient analysis and visual presentation of related resources. More specifically, the present invention relates to a method and system for analyzing and presenting groupings of related resources in a manner that assists the user in identifying the various correlations and interactions that exist between the discrete resources within the grouping. [0003] As technology has progressed and use of the Internet has become more wide spread, the ability for people to collaborate across long distances and share vast volumes of information has dramatically increased. In fact, largely as a result of the Internet and the convergence of communication technologies, data coll...

Claims


Application Information

Patent Timeline
Patent Type & Authority Applications(United States)
IPC IPC(8): G06F17/21
CPCG06T11/206H04L43/045H04L43/14
Inventor GLOOR, PETER A.
Owner IQUEST GLOBAL CONSULTING
Why Eureka
Try Eureka