[0105] An
advantage of the present invention over the prior art is that it can be applied to any automated valuation model without an understanding of the underlying mathematical and algorithmic architecture. The method of this invention is completely separate from an individual automated valuation model's methods. Using the method of this invention, a forecast standard deviation may be created for any automated valuation model. To apply the method of this invention all that is necessary is the publicly-available
data set of sold properties and any available appraisals to be used as reference values and the automated valuation model valuations of the automated valuation model to be tested for those same reference values. Therefore, the method of this invention may be applied to any automated valuation model without reference to the internal mathematical and algorithmic architecture.
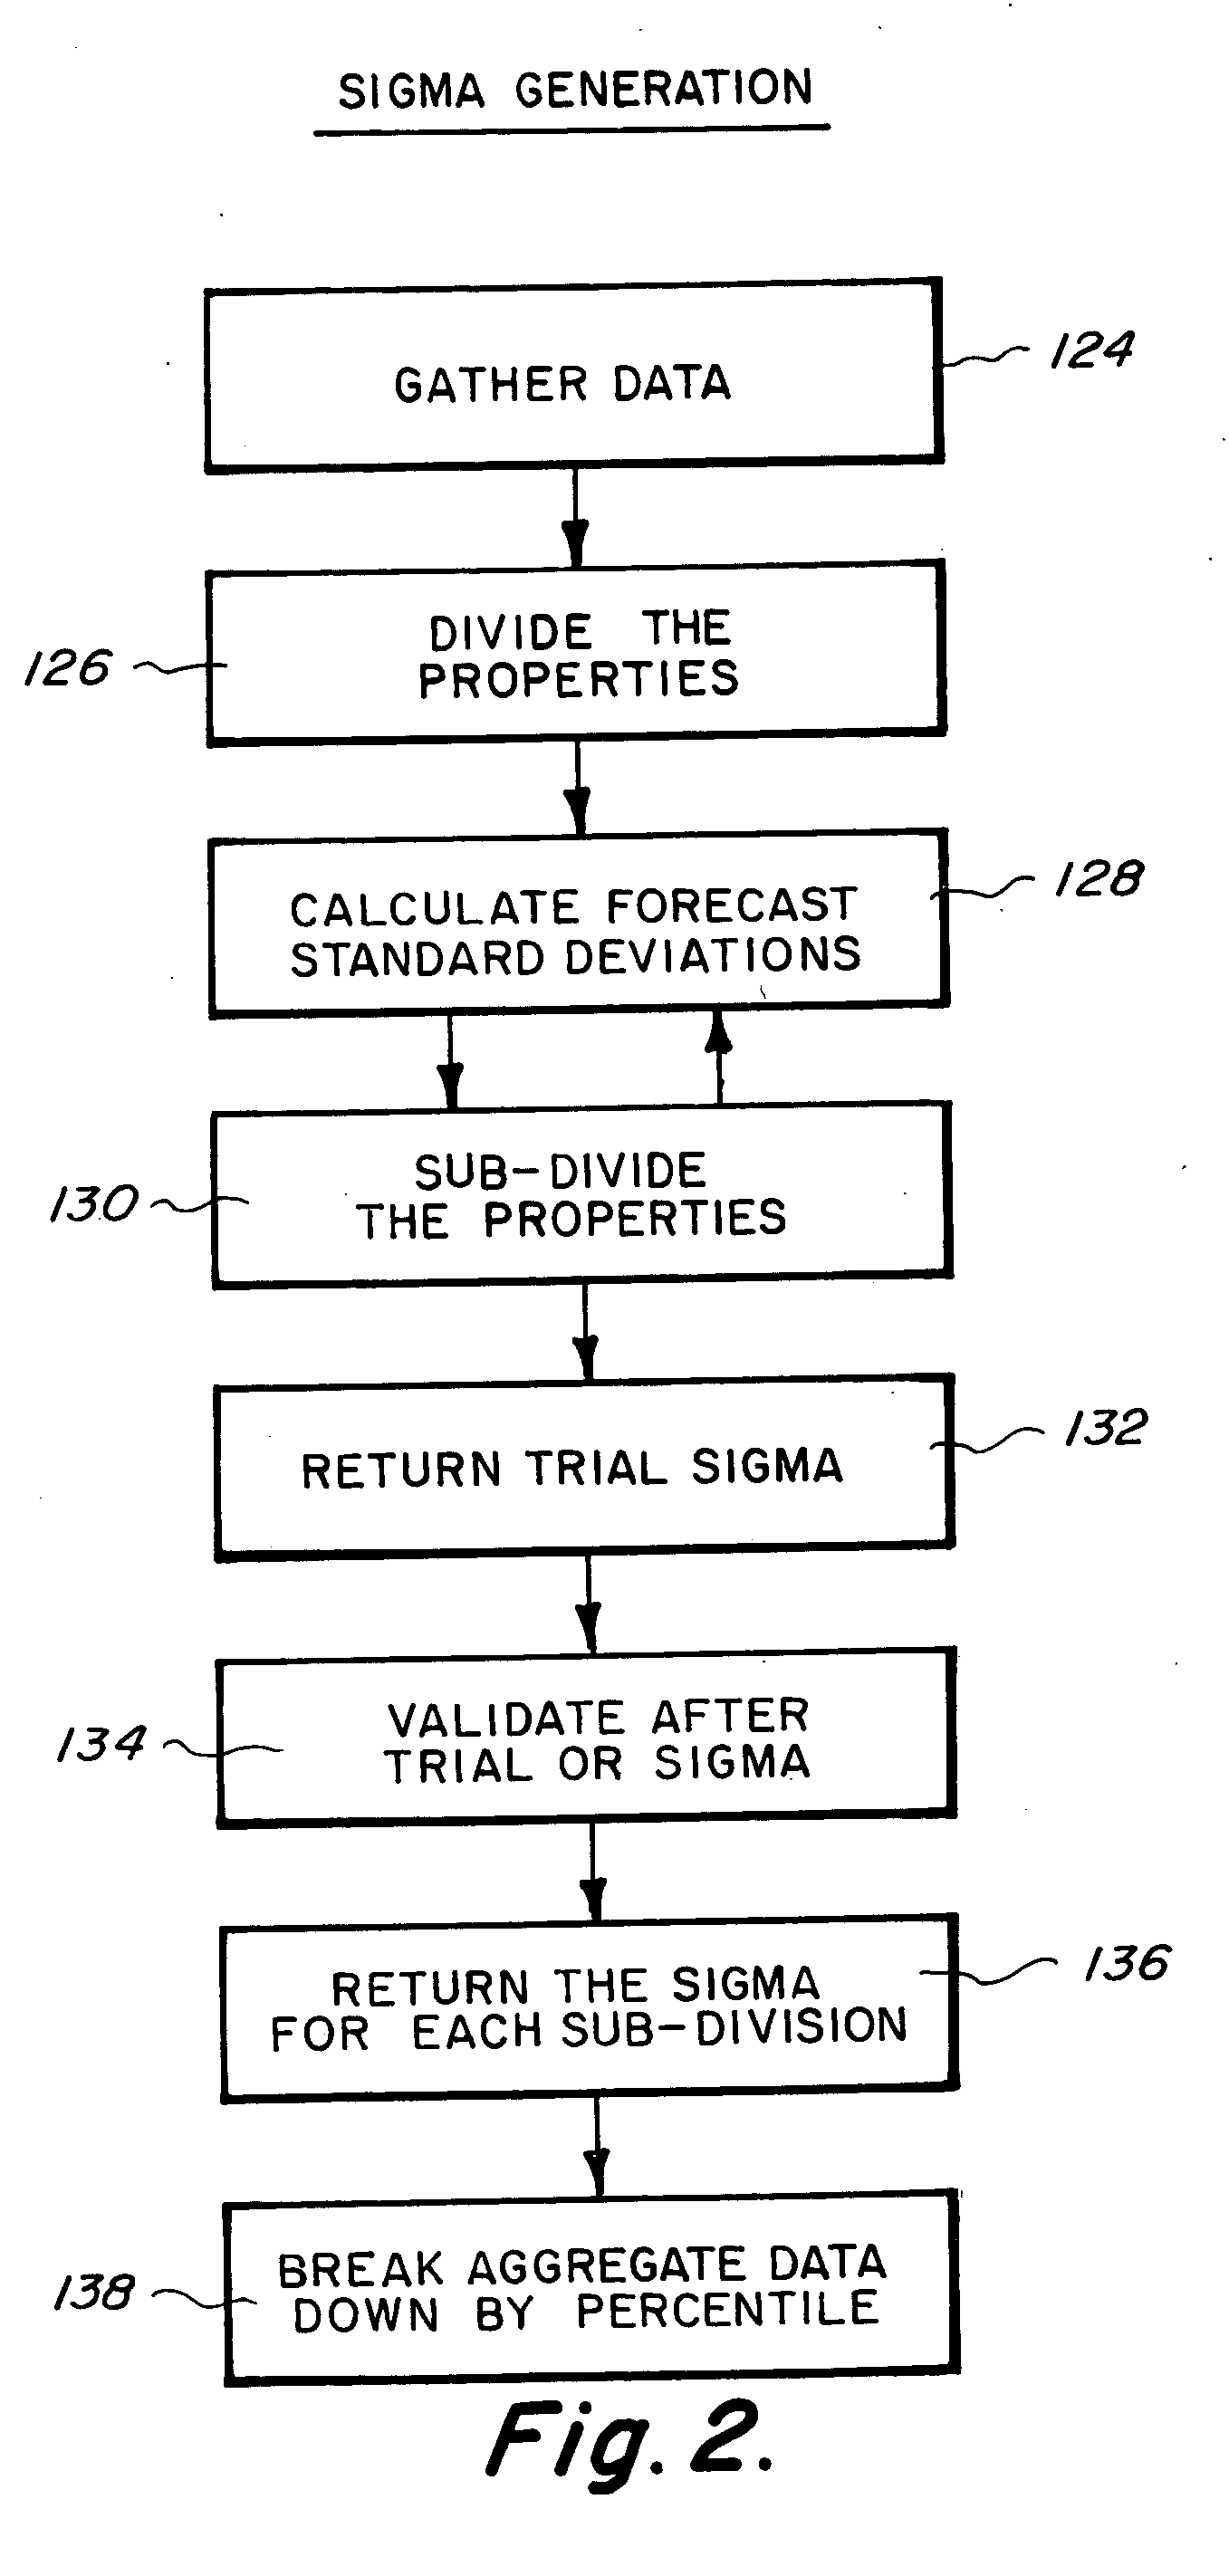
[0106] The next step in creating a forecast standard deviation is to further sub-divide the properties 130. In the preferred embodiment, the properties are subdivided as many times as possible to receive as closely tailored results as possible. However, in alternative embodiments of the invention, there may be no further sub-division or only one additional sub-division performed. Multiple sub-division is preferred in order to receive more accurate and closely tailored results. In this way, forecast standard deviations can be constructed upon finely detailed and subdivided subsets of the overall
data set, making it possible to assign carefully tailored forecast standard deviations to future valuation requests. Literally thousands of possible forecast standard deviations, based on thousands of small and carefully defined subsets of properties, may be
cons tructed and then assigned to future valuation requests for properties with characteristics belonging to the appropriate subset or subsets. In the preferred embodiment, the process of subdividing only continues so long as the
data set is of sufficient size to produce results that are understandable and accurate.
[0107] The first sub-division in the preferred embodiment is a state-by-state division within each raw or
confidence score level. A different first sub-division could be chosen, but this has been shown to bear the most dramatic correspondence to differing Sigma values once the first division has taken place. This is largely due to the differences in real-estate markets from state to state. Other embodiments may use alternative sub-divisions. Referring to the example using this sub-division depicted in FIG. 4, the raw
score 224, the state 226, the mean of variances 228, median of variances 230, standard deviation of variances 234, sum of the squares of variances 234, the number of cases 236, and Sigma for this state subset of the national raw
score level of 80, depicted in element 238, are shown. Similar tables for each level of raw
score,
confidence score, or similar accuracy rating may be made. For example, the same table may be created using a raw score of 81 or a raw score of 82 and so on.
[0108] For each level of accuracy indication or confidence scoring provided by the particular automated valuation model that a Sigma is being created for, an entirely new table, depicting each state at that confidence indicator level, could be created, even if the form of
confidence score delivery was quite different. For example, an alternative confidence score may be given in letter-grades, such that “A” is a high confidence indicator and “F” is a
low confidence indicator. For such an automated valuation model, tables such as this one could be created for each of “A,”“B,”“C,”“D” and “F.” Finer grained raw scores or other confidence indicators are preferred because they will generate finer-grained results. In the preferred embodiment, Sigma results were first generated for raw scores of forty to one hundred, thus providing sixty-one levels of Sigma. Within each raw score there are as many sub-groups as there are states being studied. Calculating Sigma separately upon each sub-group results in thousands of possible Sigmas, each belonging to a particular sub-group.
[0109] For the raw score of 80, and the state of Arizona, depicted in element 240, the Sigma as calculated using the above-referenced forecast standard deviation formula is 14.17%, depicted in element 242. For California 244, the Sigma is 14.20%, depicted in element 246. Using this information, a lender could determine that at a raw score of 80 in the state of California, approximately 68.3% of valuations given by the automated valuation model for which the Sigma was generated are within 14.20% of the reference values, actual sale prices or appraisals. Similarly, a user could tell that in the state of Arizona at a raw score of 80 that approximately 68.3% of the valuations given by the automated valuation model for which the Sigma was generated are within 14.17% of the reference values.
[0110] In order to sub-divide, as depicted in FIG. 4, and to perform subsequent sub-divisions, a certain number of cases should be present in order to ensure accurate Sigma generation. If the required number is not present, the calculated Sigma is not used and for that sub-division, all Sigmas are referred to the immediately higher-level division. In the preferred embodiment, the required number of cases is one hundred. Other numbers of cases could be used, though a minimum of one hundred has been found to provide the most accurate Sigma while retaining the virtues of finely-grained Sigma values most directly related to the properties to which they are applied. Using the preferred embodiment, the Sigma produced for Wisconsin at a raw score level of 80 would not be accurate enough to rely upon, because there are only 59 valuations in that sub-division.

