Root-cause analysis of network performance problems

a root cause analysis and network performance technology, applied in the field of computer systems and networks, to achieve the effect of reducing the computational burden of finding

Inactive Publication Date: 2006-09-28
IBM CORP
View PDF16 Cites 116 Cited by
  • Summary
  • Abstract
  • Description
  • Claims
  • Application Information

AI Technical Summary

Benefits of technology

[0007] Embodiments of the present invention provide efficient methods and systems for diagnosing the root cause of network performance problems, and specifically I / O-related network problems. These methods and systems are particularly suited for networks that are dedicated to providing specific resources, such as providing storage resources in a SAN, in which communication channels are dedicated to I / O traffic. When a performance problem is reported by a consumer of a resource in such a network, such as an application running on a server, it is likely that the root cause of the problem can be found at some node along an I / O path connecting the consumer to a provider of the resource to this consumer, such as a storage logical unit located on a back-end disk controller. Therefore, embodiments of the present invention first locate the I / O paths within the network that serve the consumer in question, and then focus the search for problematic nodes along these paths. The inventors have found that this sort of “informed search” approach reduces substantially the computational burden of finding the root cause of network problems in comparison with search methods known in the art.
[0008] In the embodiments of the present invention that are described hereinbelow, the search for problematic nodes makes use of available information regarding the physical and logical configuration of the network in question. Based on this information, a performance analyzer constructs a graph representing the topology of the network. Upon receiving a report of a performance problem encountered by a given consumer, the performance analyzer traces the I / O paths through the graph that emanate from this consumer. These I / O paths connect one or more of the providers of the resources via intermediate nodes (referred to as “mediators”) to the given consumer. Typically, the performance analyzer uses the logical topology of the network in order to focus only on those physical paths along which the consumer can actually access the providers, and thus eliminates paths in the graph that are logically not allowed.

Problems solved by technology

When a performance problem is reported by a consumer of a resource in such a network, such as an application running on a server, it is likely that the root cause of the problem can be found at some node along an I / O path connecting the consumer to a provider of the resource to this consumer, such as a storage logical unit located on a back-end disk controller.

Method used


Image

  • Root-cause analysis of network performance problems
  • Root-cause analysis of network performance problems
  • Root-cause analysis of network performance problems

Examples


Embodiment Construction

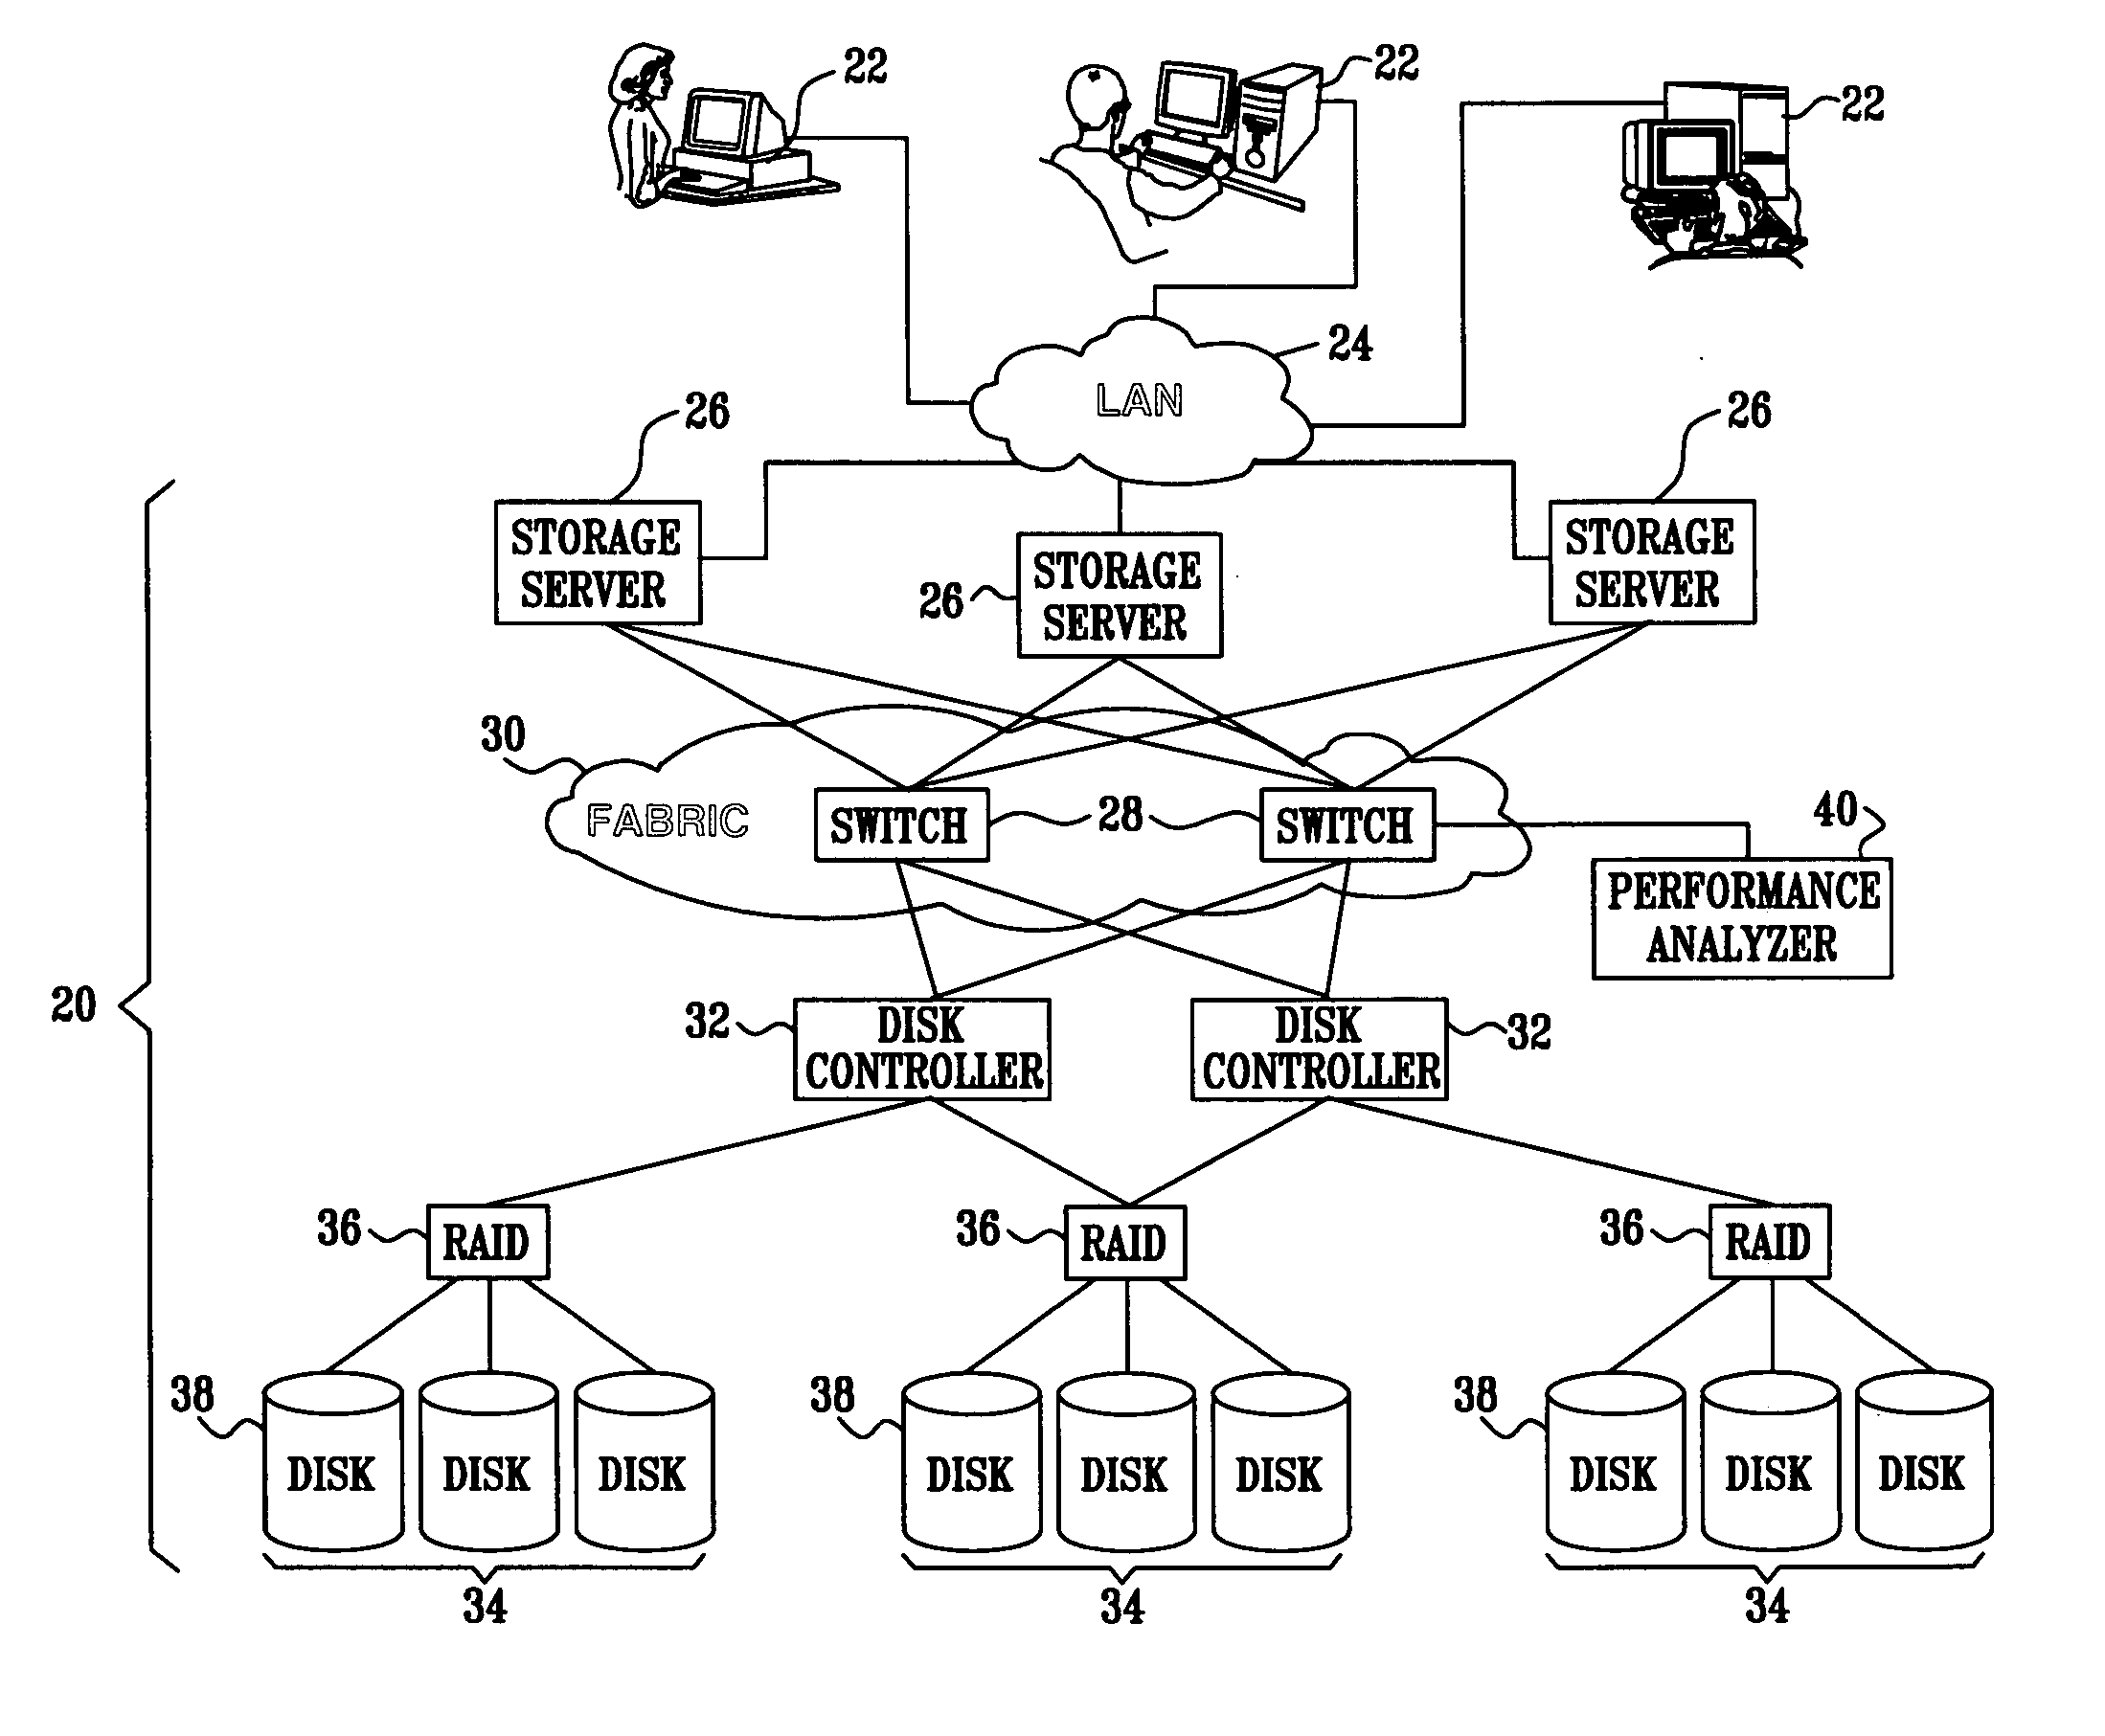
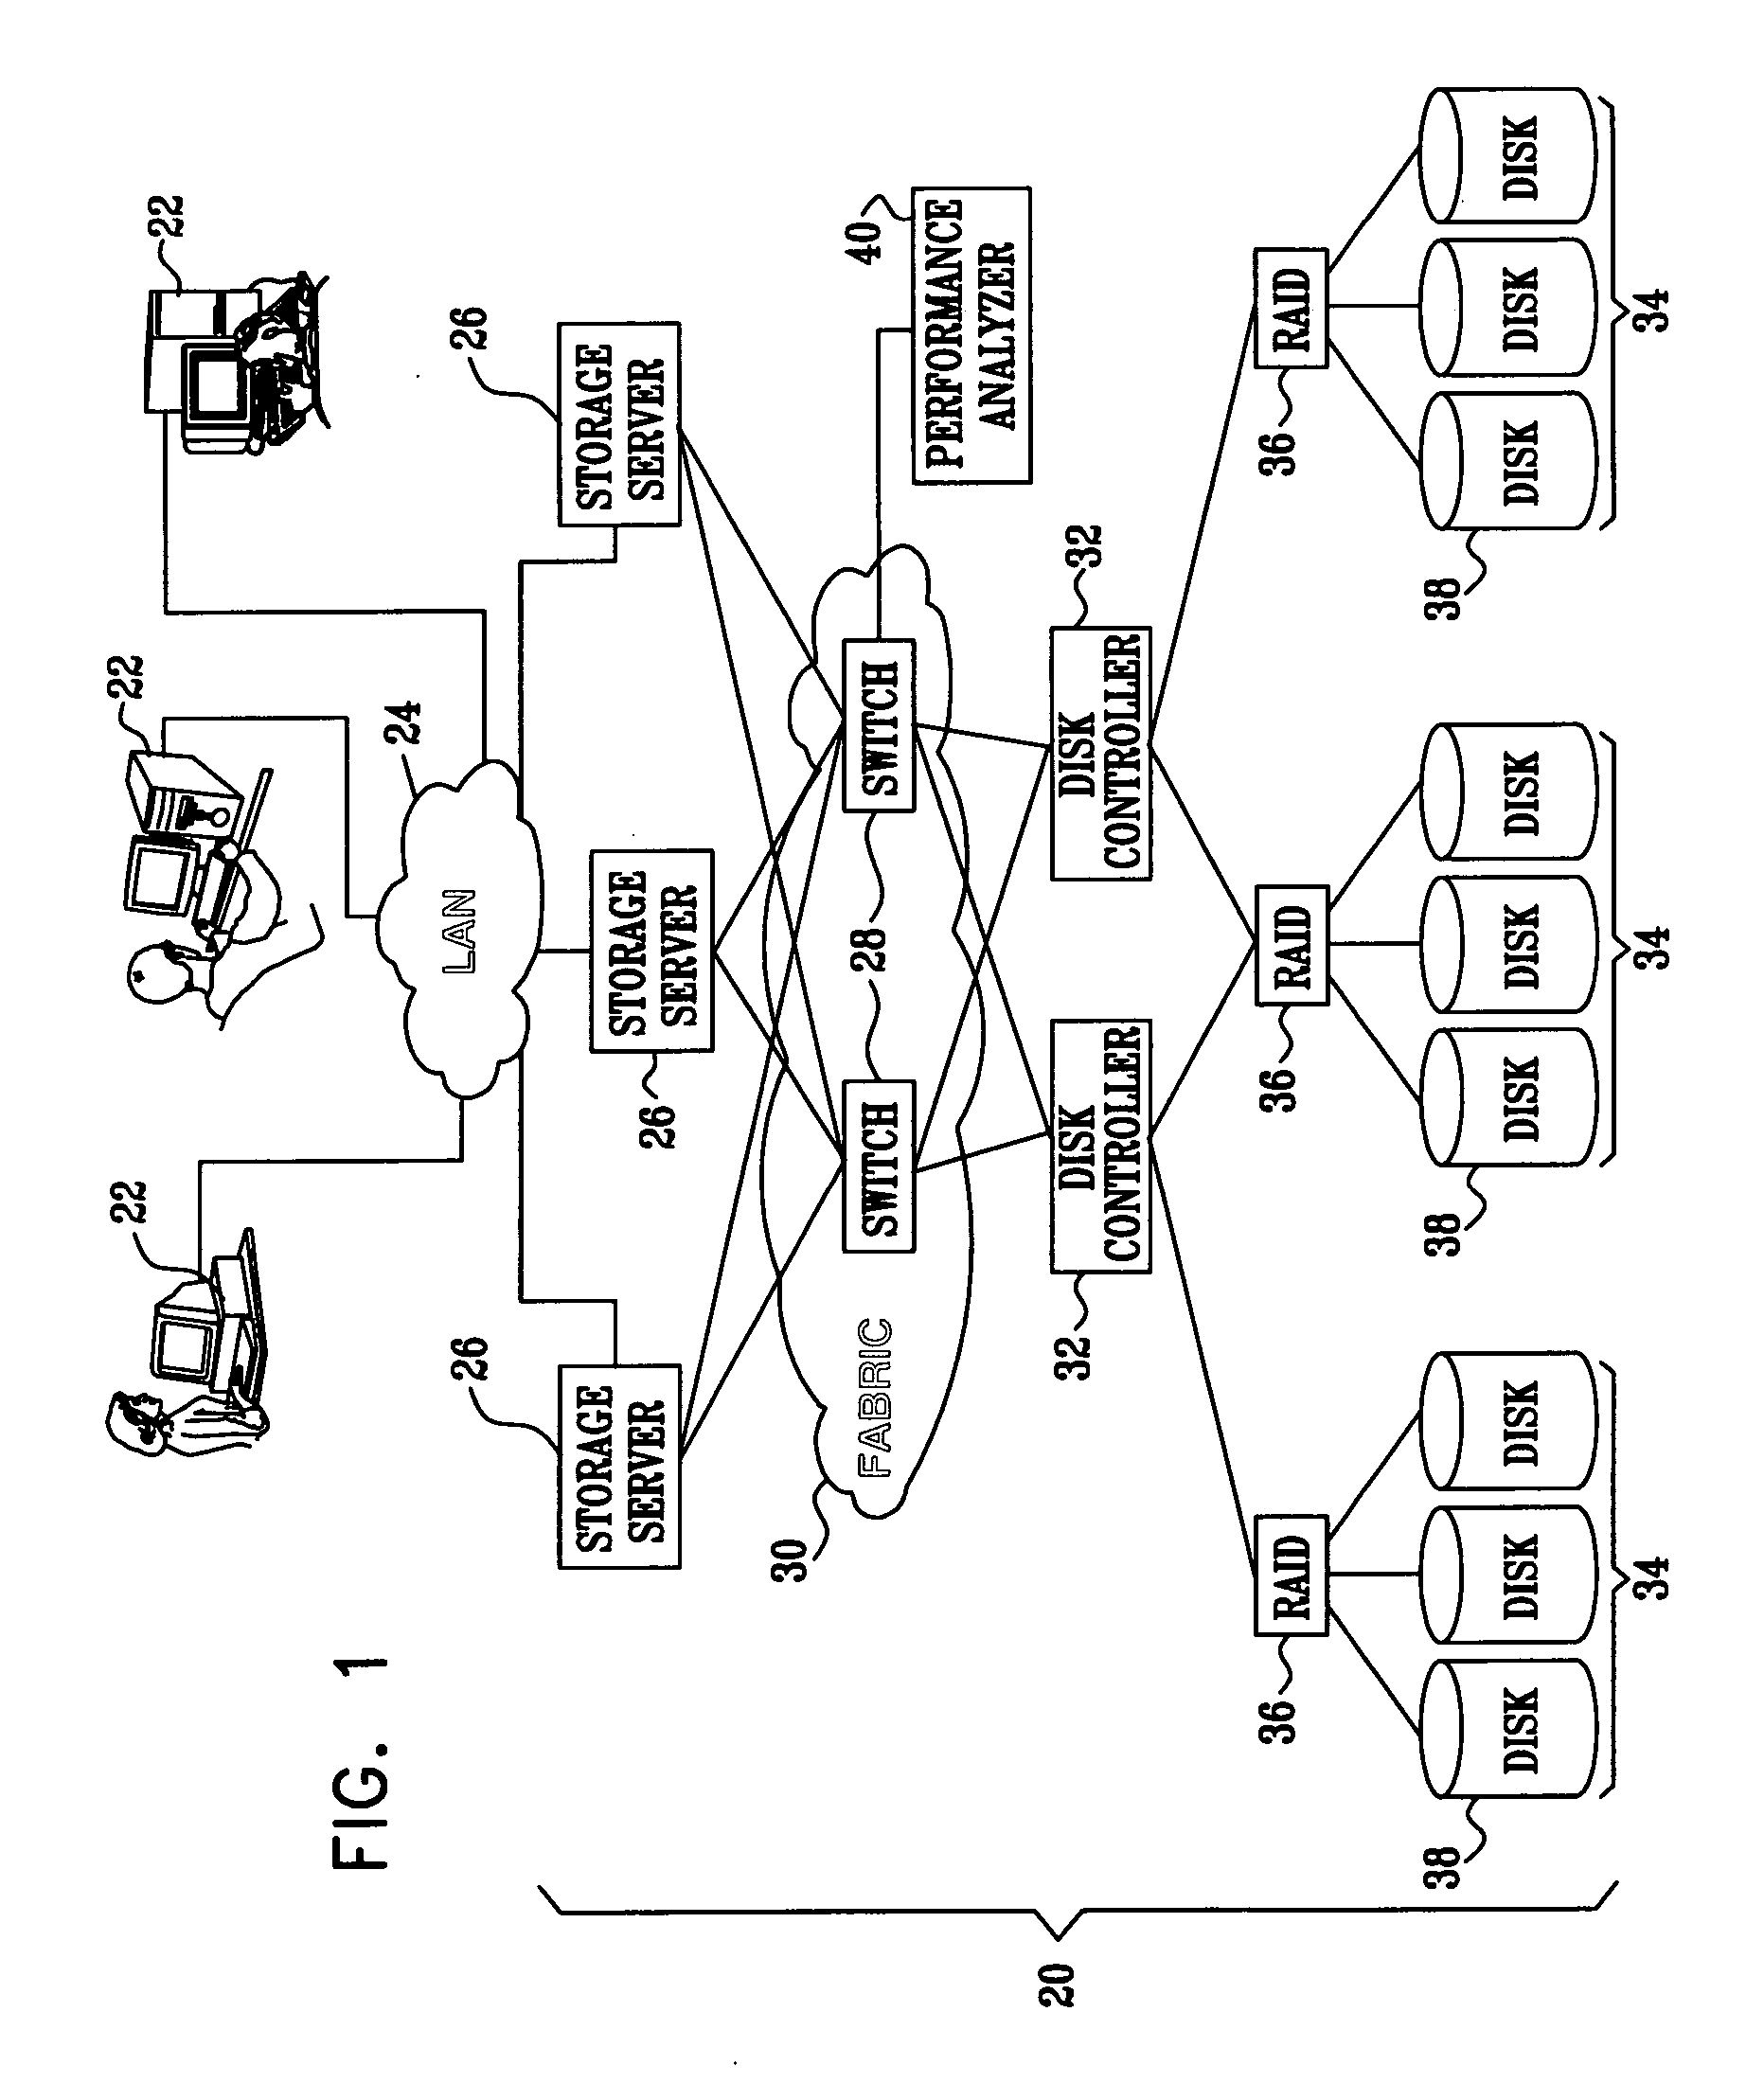
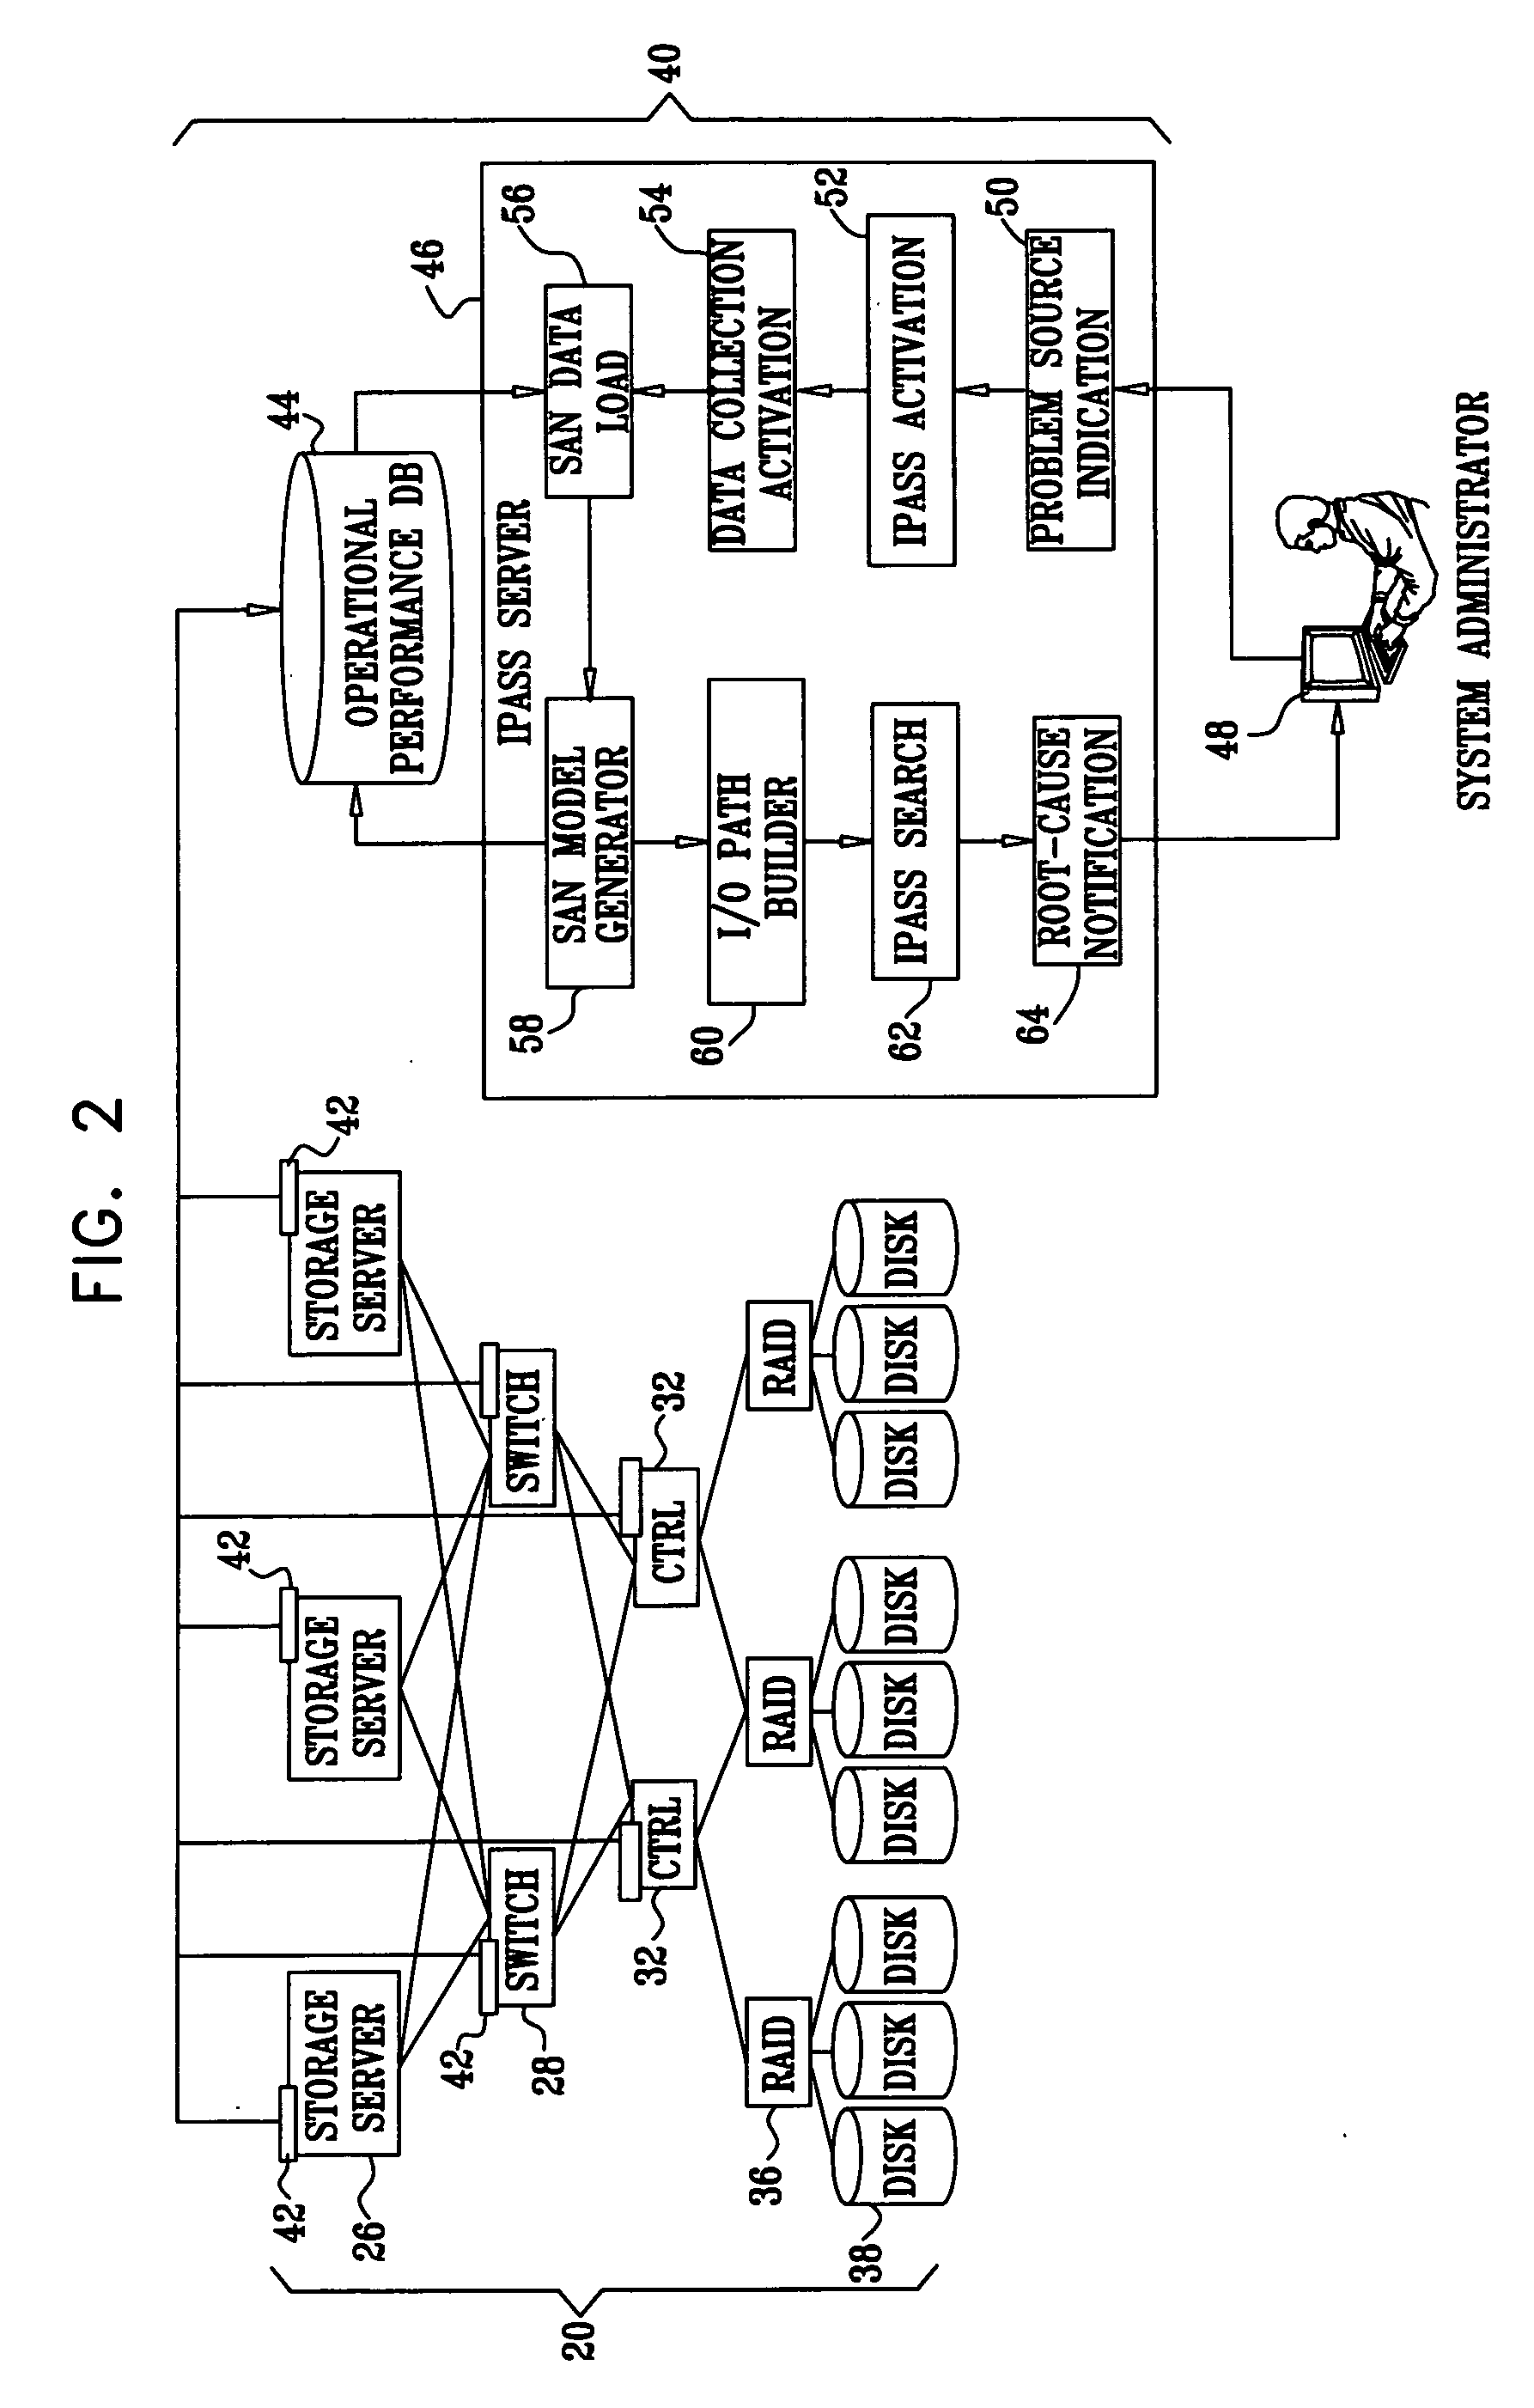
[0031]FIG. 1 is a block diagram that schematically illustrates a storage area network (SAN) 20 with a performance analyzer 40, in accordance with an embodiment of the present invention. The SAN is optimized for carrying only I / O traffic between storage servers 26 and storage devices 34, and possibly among the storage devices themselves. Application traffic to and from clients 22 is carried by a separate messaging network 24, such as a local area network (LAN) or wide area network (WAN).

[0032] Typically, storage servers 26 communicate with storage devices 34 in SAN 20 via one or more switches 28, which are commonly arranged as a switching fabric 30. Access to storage devices 34 is carried out through disk controllers 32, such as the IBM Sharks controller. The storage devices themselves may comprise substantially any type (or multiple types) of storage media, such as magnetic disks or tape or optical media. For the sake of simplicity in the present example, the storage devices are as...


PUM


Abstract

A method for diagnosing network performance problems includes providing a graph representing a topology of a network including first nodes that are classified as providers of a resource, second nodes that are classified as consumers of the resource, and third nodes that are classified as mediators intervening between the providers and the consumers. Responsively to a report of a performance problem encountered by a given consumer in the network, at least one input / output (I / O) path is traced through the graph connecting the given consumer to one or more of the providers. One or more problematic nodes are identified along the at least one I / O path as possible causes of the performance problem.

Description

FIELD OF THE INVENTION [0001] The present invention relates generally to computer systems and networks, and specifically to diagnosis of performance problems in computer networks. BACKGROUND OF THE INVENTION [0002] A Storage Area Network (SAN) is a dedicated high-speed network connecting multiple storage servers (hosts) to multiple storage devices. The SAN model creates a pool of storage that can be shared by multiple consumers, consolidating heterogeneous storage resources across an enterprise. Communications within the SAN are typically optimized for carrying input / output (I / O) traffic between the storage servers and the storage devices and, possibly, among the storage devices themselves without intervention of the server. Application traffic is generally handled by a separate messaging network, such as a LAN or WAN. [0003] Large SANs may include thousands of different inter-related logical and physical entities. When an application performance problem is detected and reported, ei...

Claims


Application Information

Patent Timeline
Patent Type & Authority Applications(United States)
IPC IPC(8): H04L12/26H04J1/16
CPCH04L41/0631H04L41/12H04L41/18H04L43/0811
Inventor BREITGAND, DAVIDHENIS, EALANLADAN-MOZES, EDYASHEHORY, ONNYERUSHALMI, ELENA
Owner IBM CORP
Why Eureka
Try Eureka