System and method for three dimensional change detection and measurement of a scene using change analysis

a three-dimensional change and change analysis technology, applied in the field of image data processing systems, can solve problems such as typically much more labor-intensive production

Active Publication Date: 2006-10-12
HARRIS CORP
View PDF7 Cites 41 Cited by
  • Summary
  • Abstract
  • Description
  • Claims
  • Application Information

AI Technical Summary

Problems solved by technology

The downside to 3D Models is that they are typically much more labor-intensive to produce than is a DTM for the same scene.

Method used


Image

  • System and method for three dimensional change detection and measurement of a scene using change analysis
  • System and method for three dimensional change detection and measurement of a scene using change analysis
  • System and method for three dimensional change detection and measurement of a scene using change analysis

Examples


Embodiment Construction

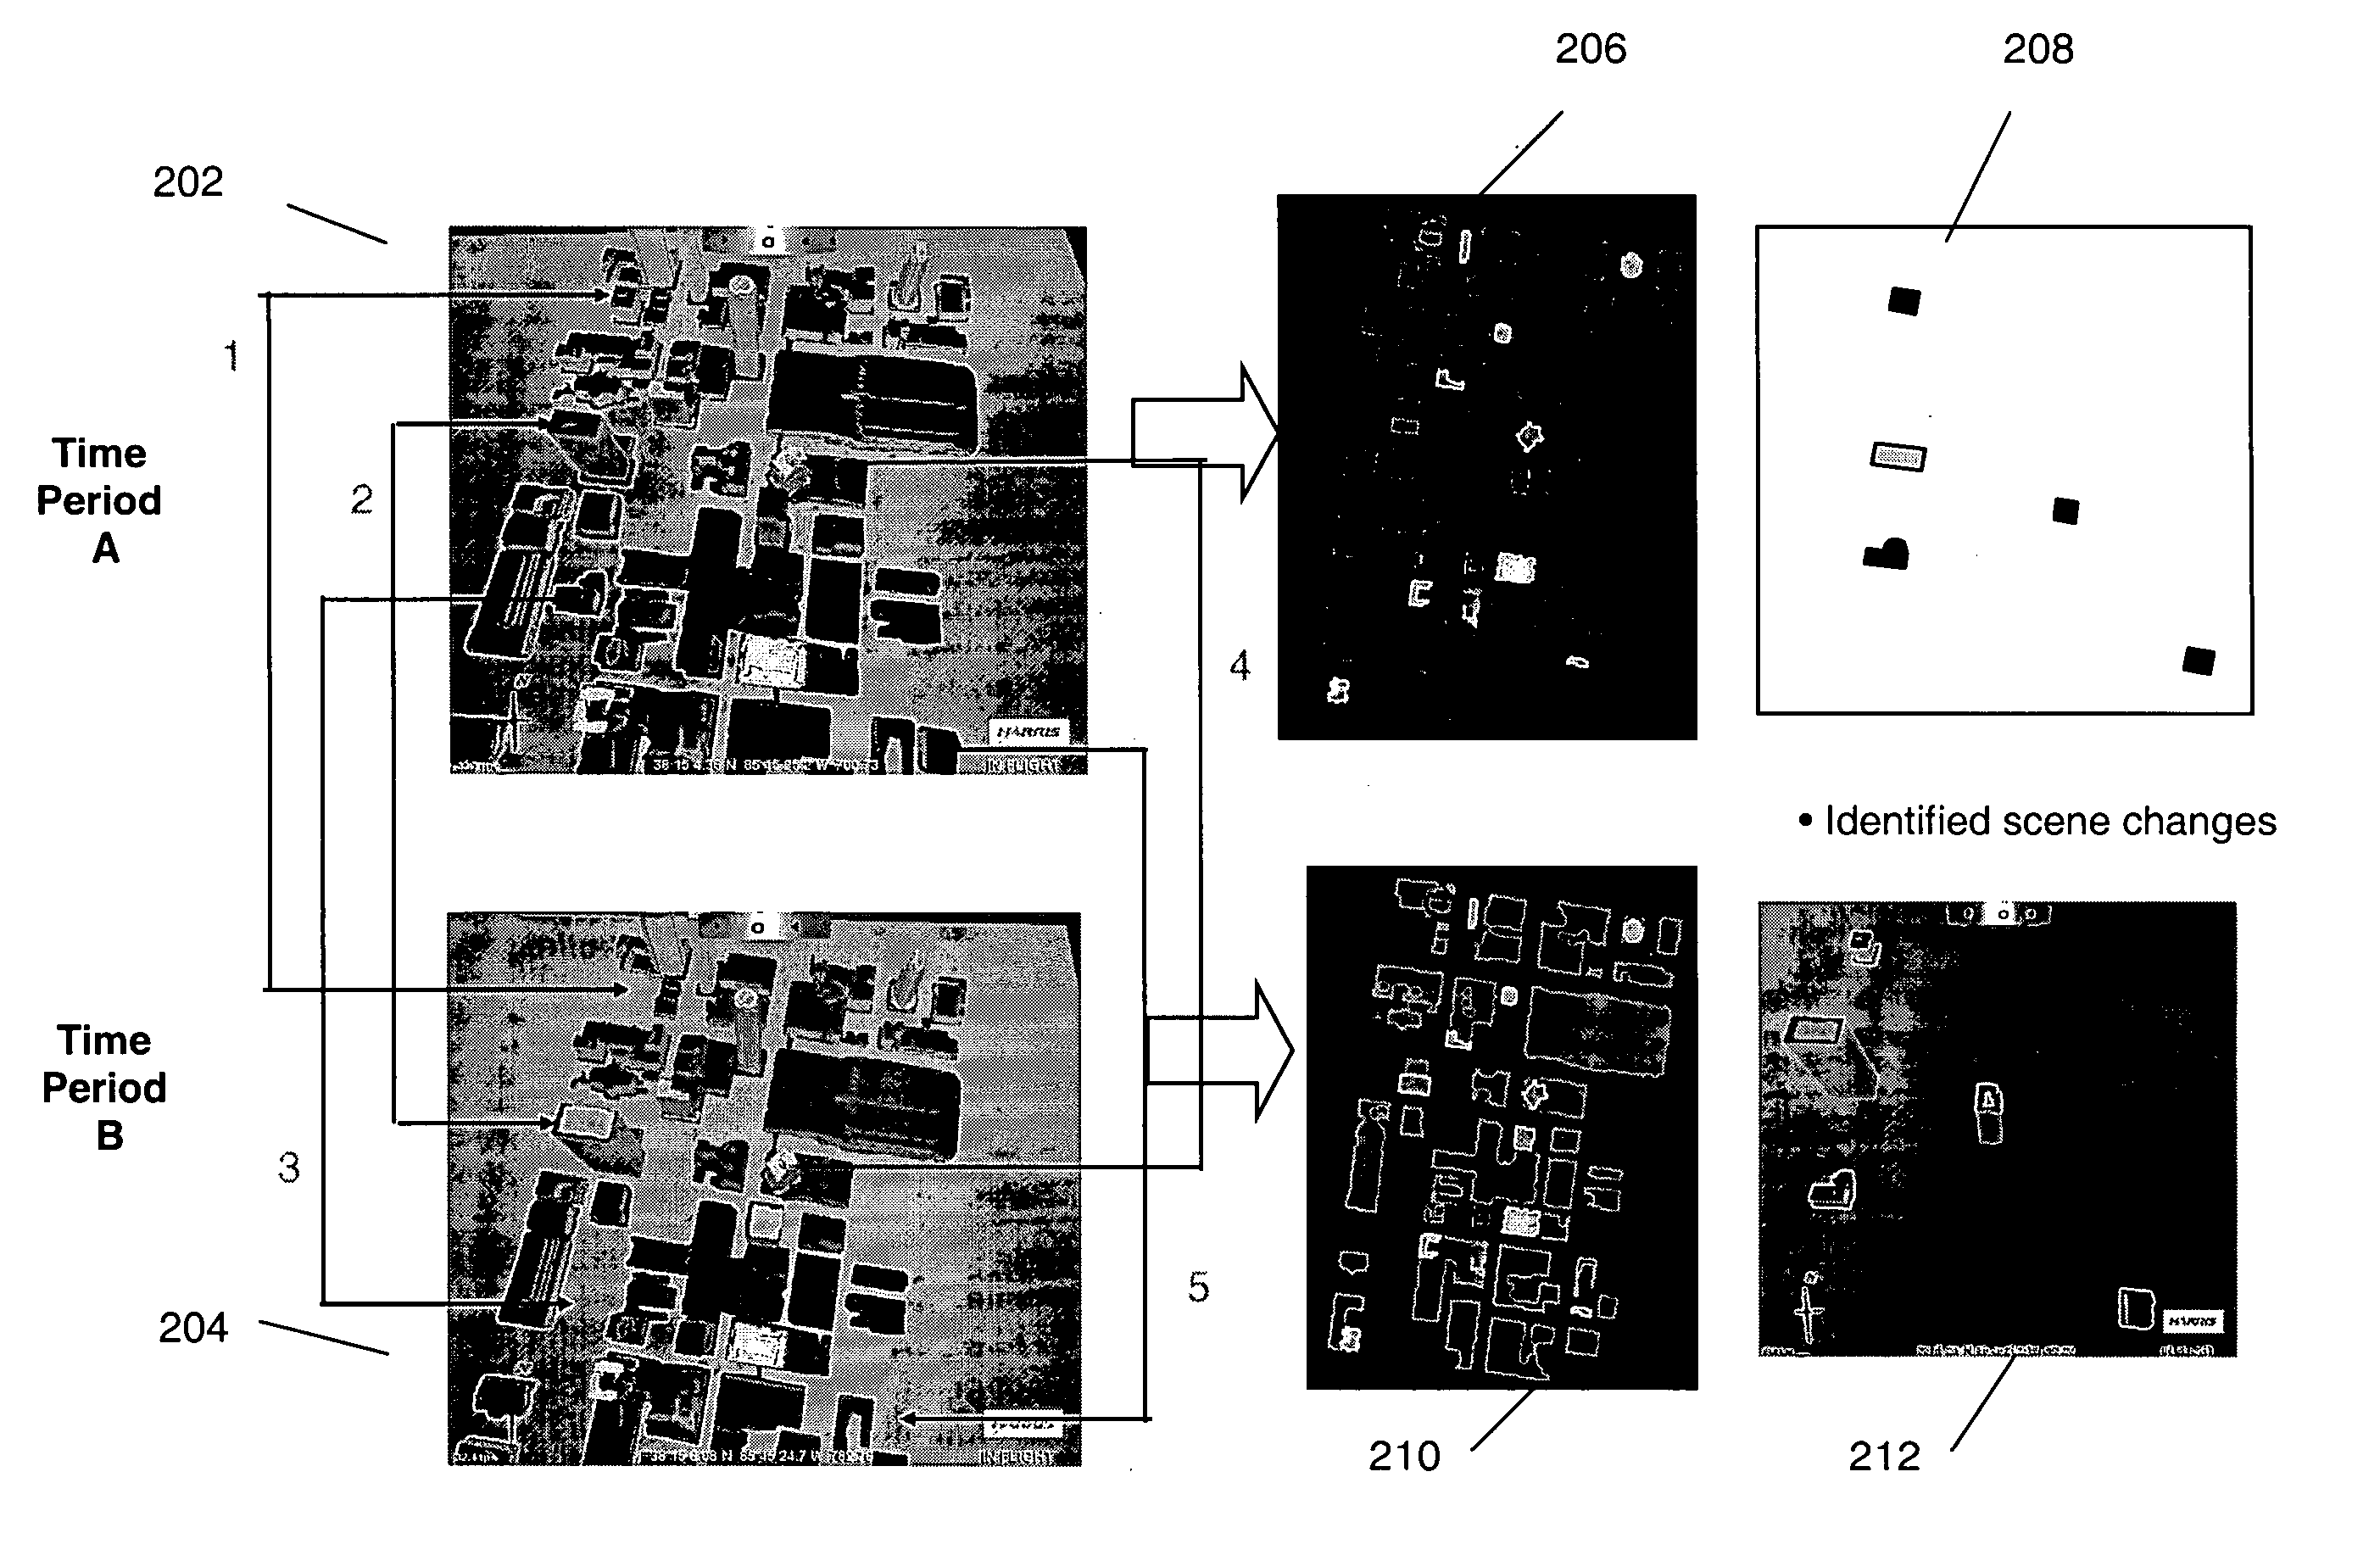
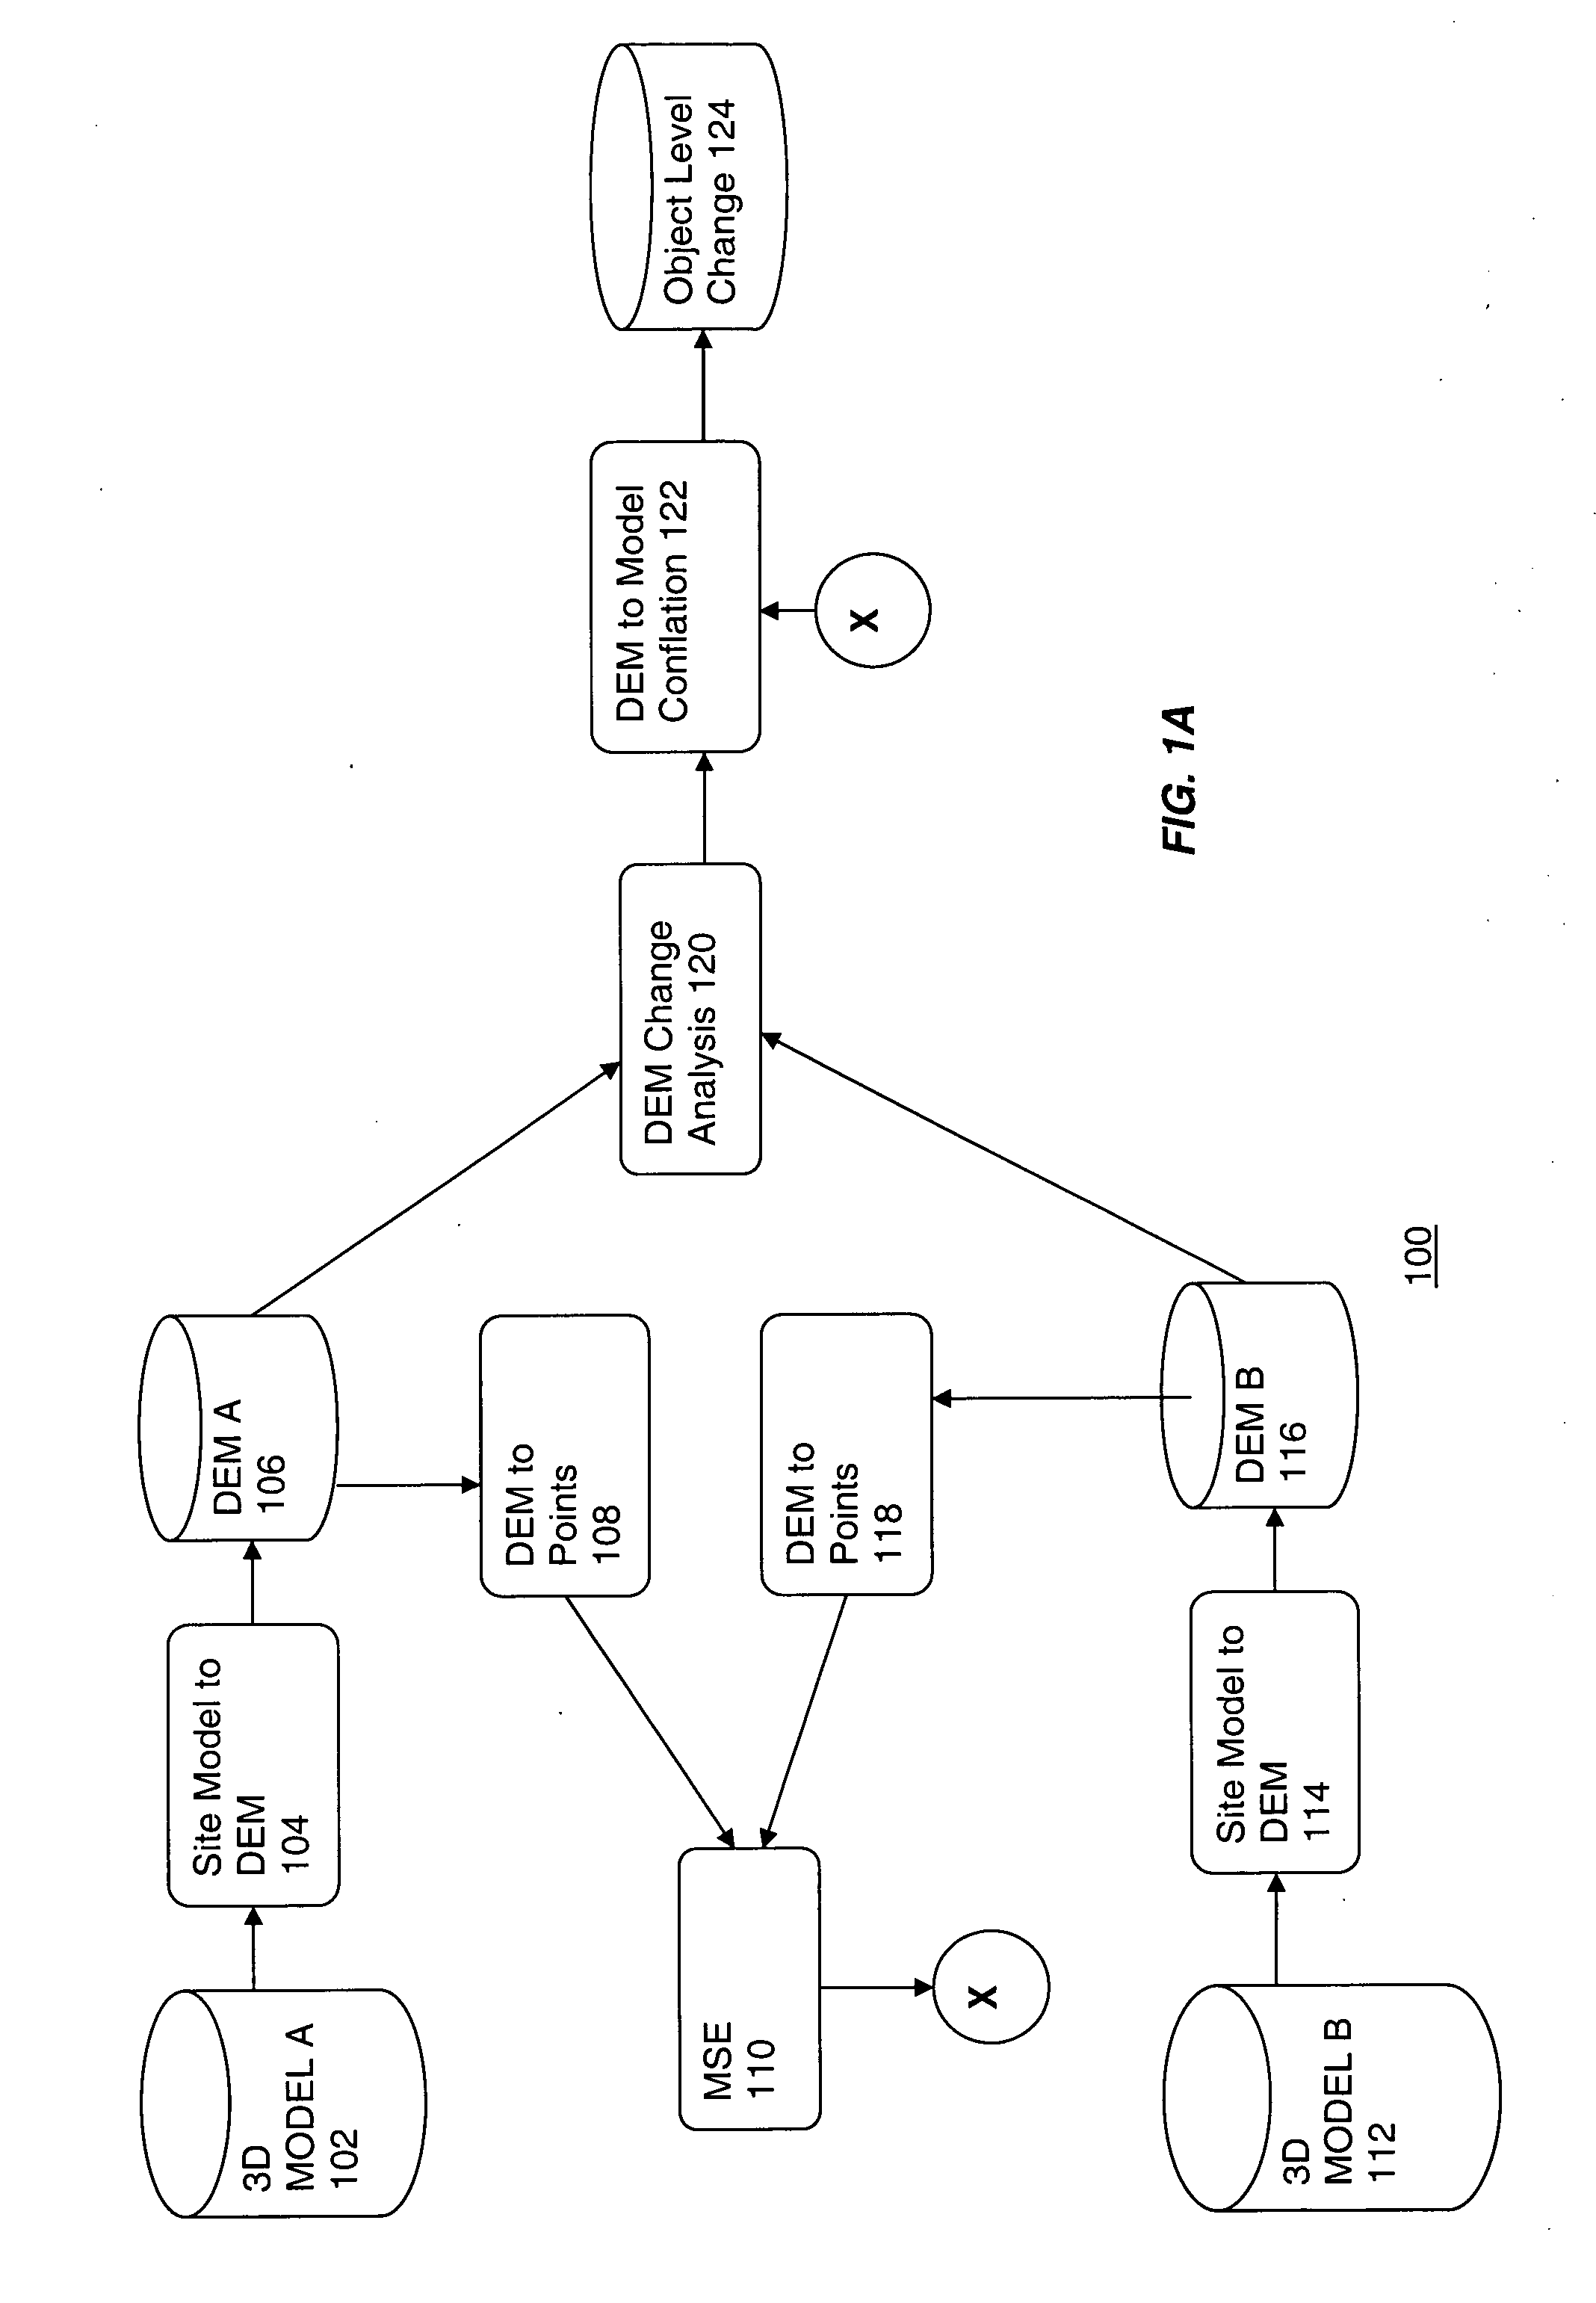
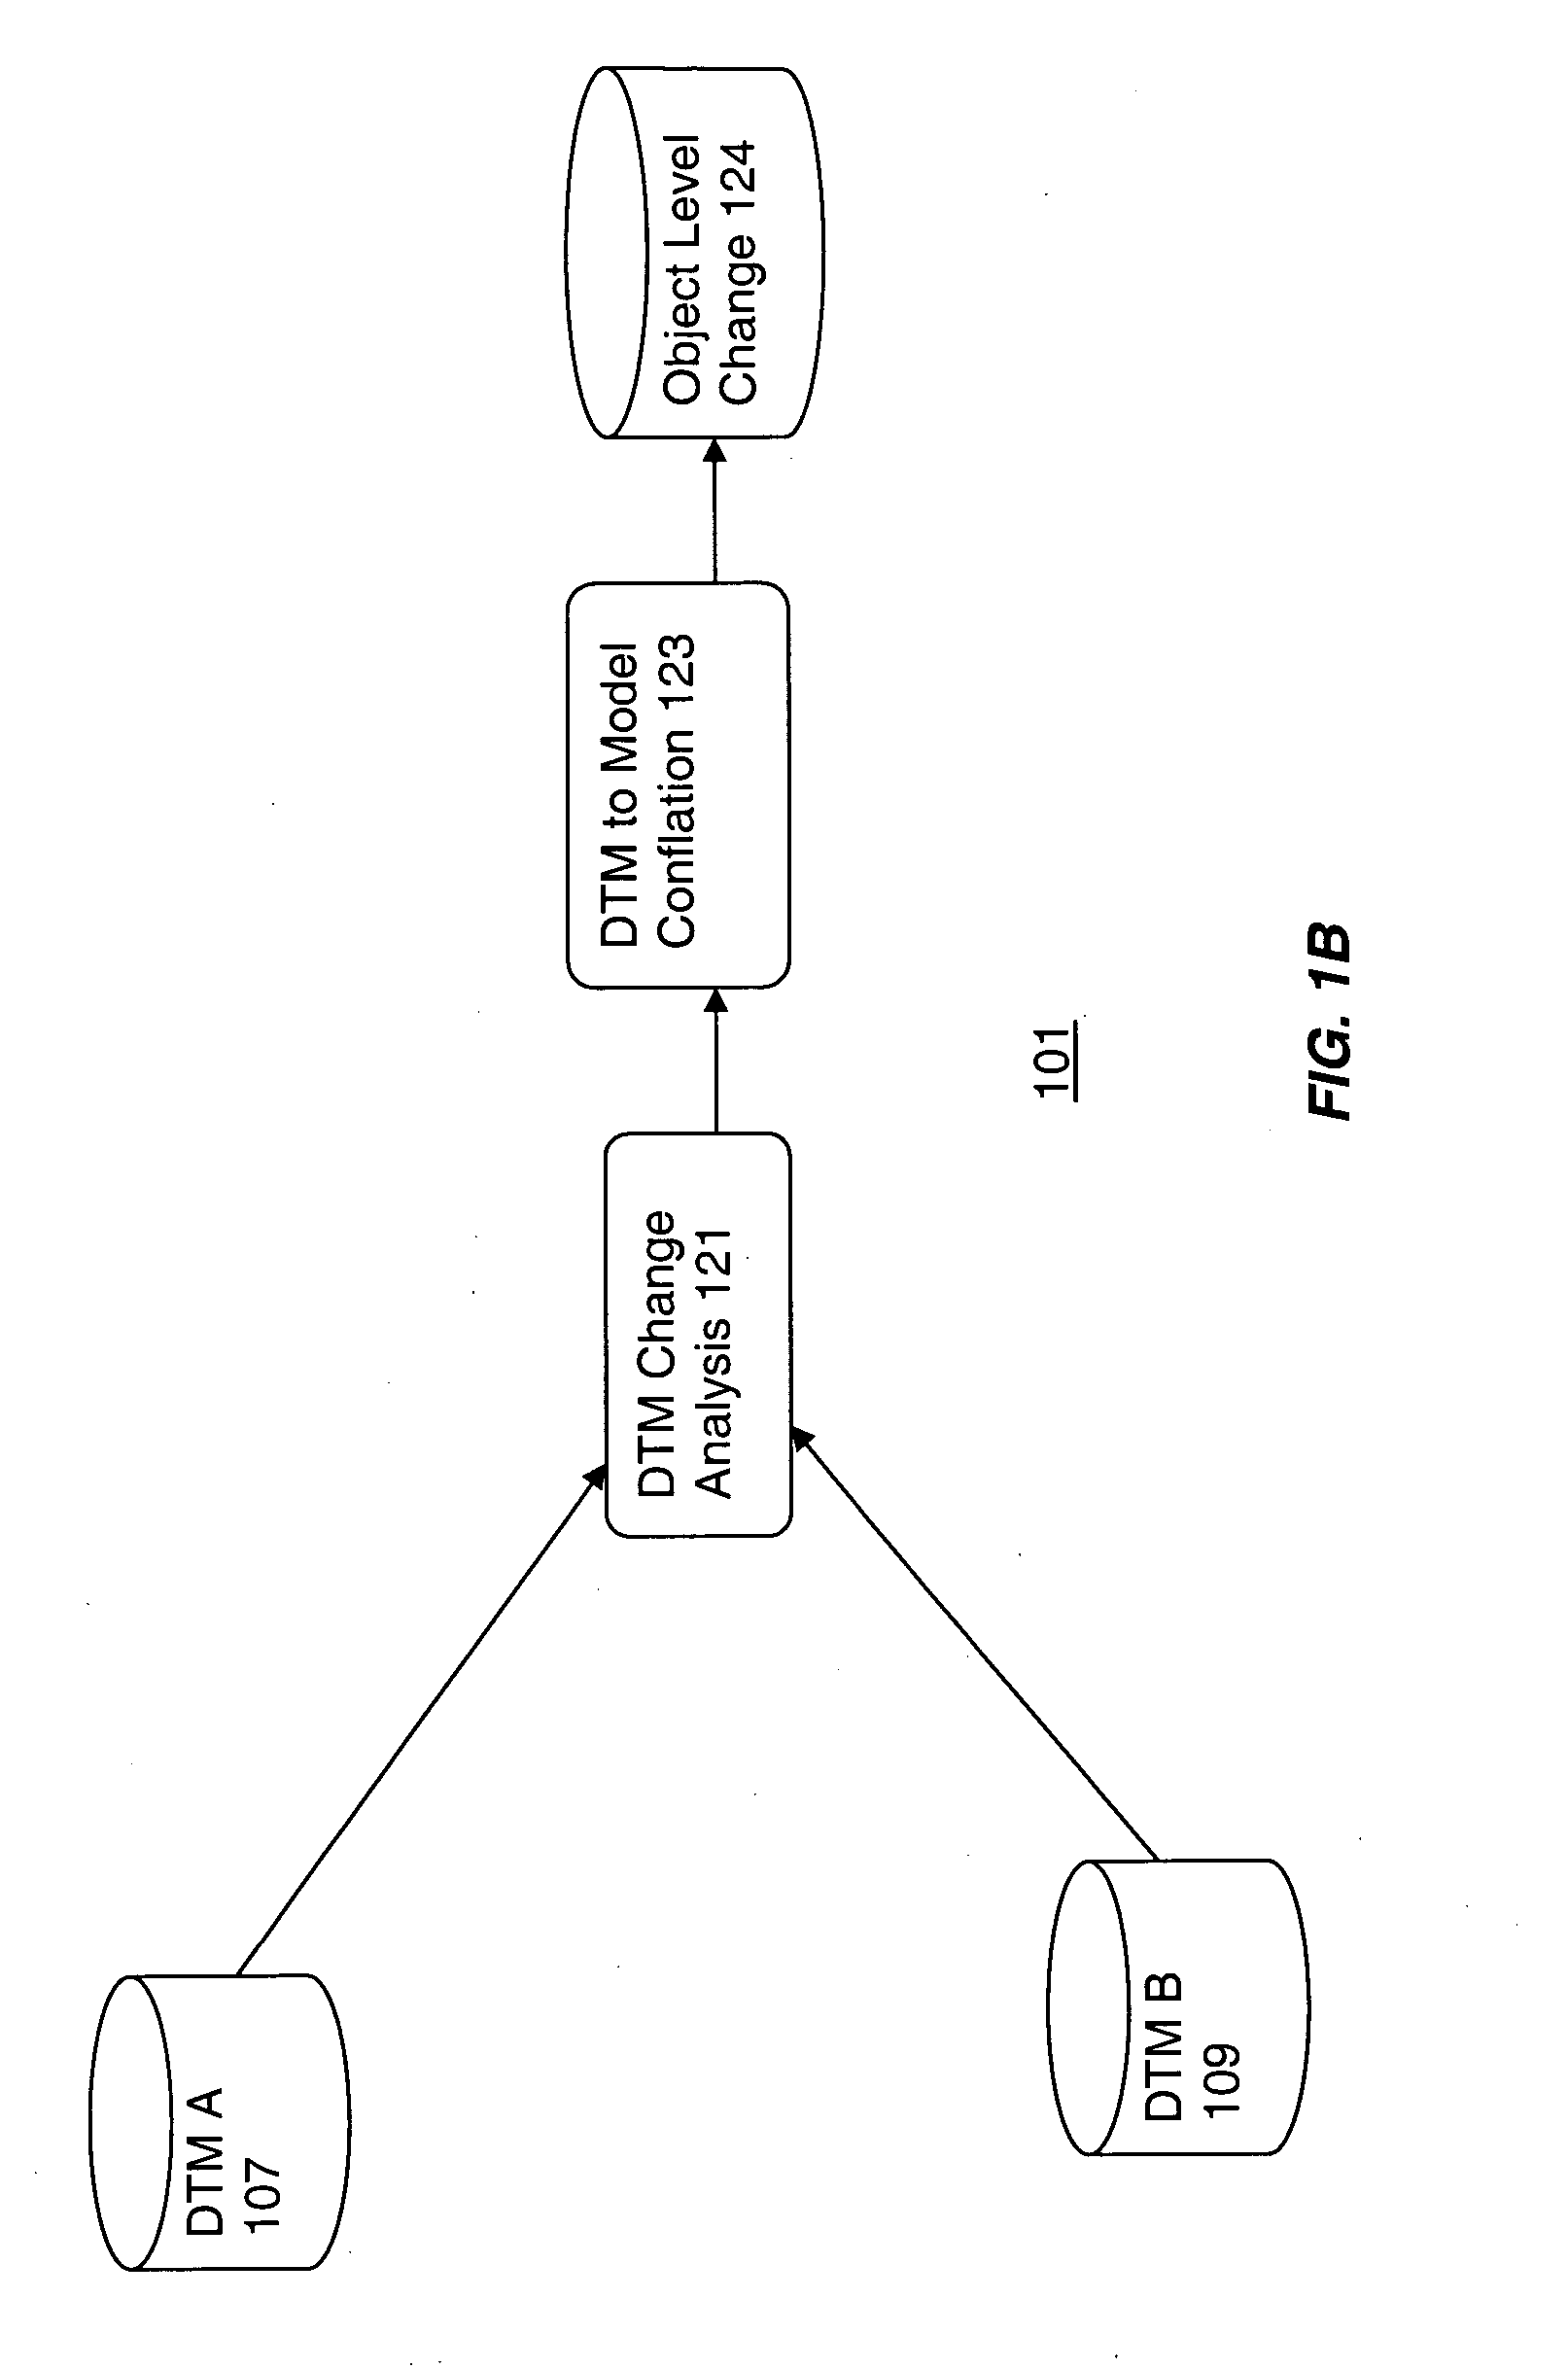
[0012]FIGS. 1A and 1B illustrate systems and methods 100 and 101, respectively, for detection of one or more differences in 3D scenes represented by digital models created with data collected form the scenes. We discuss an example where the scenes represent a city block comprising buildings and other structures that are represented as objects in their corresponding digital models. Referring first to FIG. 1A, the system 100 receives first 102 and second 112 (or 3D Model B) digital models of a three dimensional scene such as a city block (see FIG. 2). We use the term “city block” as a generic description, though the approach applies to any geospatial region of the Earth whether urban or rural or having a large or small extent. In this embodiment, the first digital model is a three-dimensional (3D) polygonal model 102 (or 3D Model A) and the second digital model is a 3D polygonal model 112, each representing a different scene (A or B). Each of the polygonal models 102 and 112 comprises...


PUM


Abstract

A method (100) comprises steps of: receiving a first digital model (102) of a first three-dimensional scene comprising at least one object; receiving a second digital model (112) of a second three-dimensional scene comprising at least one object; and performing a change analysis (102) on the first and second digital models to provide a difference indication representing a difference between the first and second models. In one embodiment a mean square error operation (110) is performed on the first and second digital models to provide a value indicating the difference between the digital models. In another embodiment, a conflation operation is performed on the difference model provided by the change analysis (120) and an object level change database (124) is produced.

Description

FIELD OF THE INVENTION [0001] The invention disclosed broadly relates to the field of image data processing systems and more particularly relates to the field of detection of changes in three-dimensional images and high-resolution terrain models. BACKGROUND OF THE INVENTION [0002] Digital representations of three dimensional (3D) scenes (or sites such as cities) are well known. Such representations are typically generated using data collected by instruments such as LIDAR (Light Detection And Ranging), IFSAR (Interferometric Synthetic Aperture Radar), photogrammetric techniques, or surveys. The collected data represents the topology of the scene. These instruments and systems produce digital terrain elevation data suitable for use in providing terrain visualization systems. However, there is a need for determining changes in these sites or scenes as they change over time (or by use of different data collection systems). That need is driven by applications such as immediate identifica...

Claims


Application Information

Patent Timeline
Patent Type & Authority Applications(United States)
IPC IPC(8): G06K9/00
CPCG06K9/00704G06K9/00637G06V20/176G06V20/39
Inventor RAHMES, MARKGARCEAU, ROBERT M.SMITH, ANTHONY O'NEILKARP, JOHNHAM, TODDELSNER, DAVIDYATES, HARLAN
Owner HARRIS CORP
Why Eureka
Try Eureka