Method for data reduction and calibration of an OCT-based blood glucose monitor

a blood glucose monitor and data reduction technology, applied in the field of data reduction and calibration of oct-based blood glucose monitors, can solve the problems of low level of compliance of diabetic patients, inconvenient use, and inability to meet the needs of diabetic patients,

Active Publication Date: 2006-11-23
MASIMO CORP
View PDF99 Cites 62 Cited by
  • Summary
  • Abstract
  • Description
  • Claims
  • Application Information

AI Technical Summary

Benefits of technology

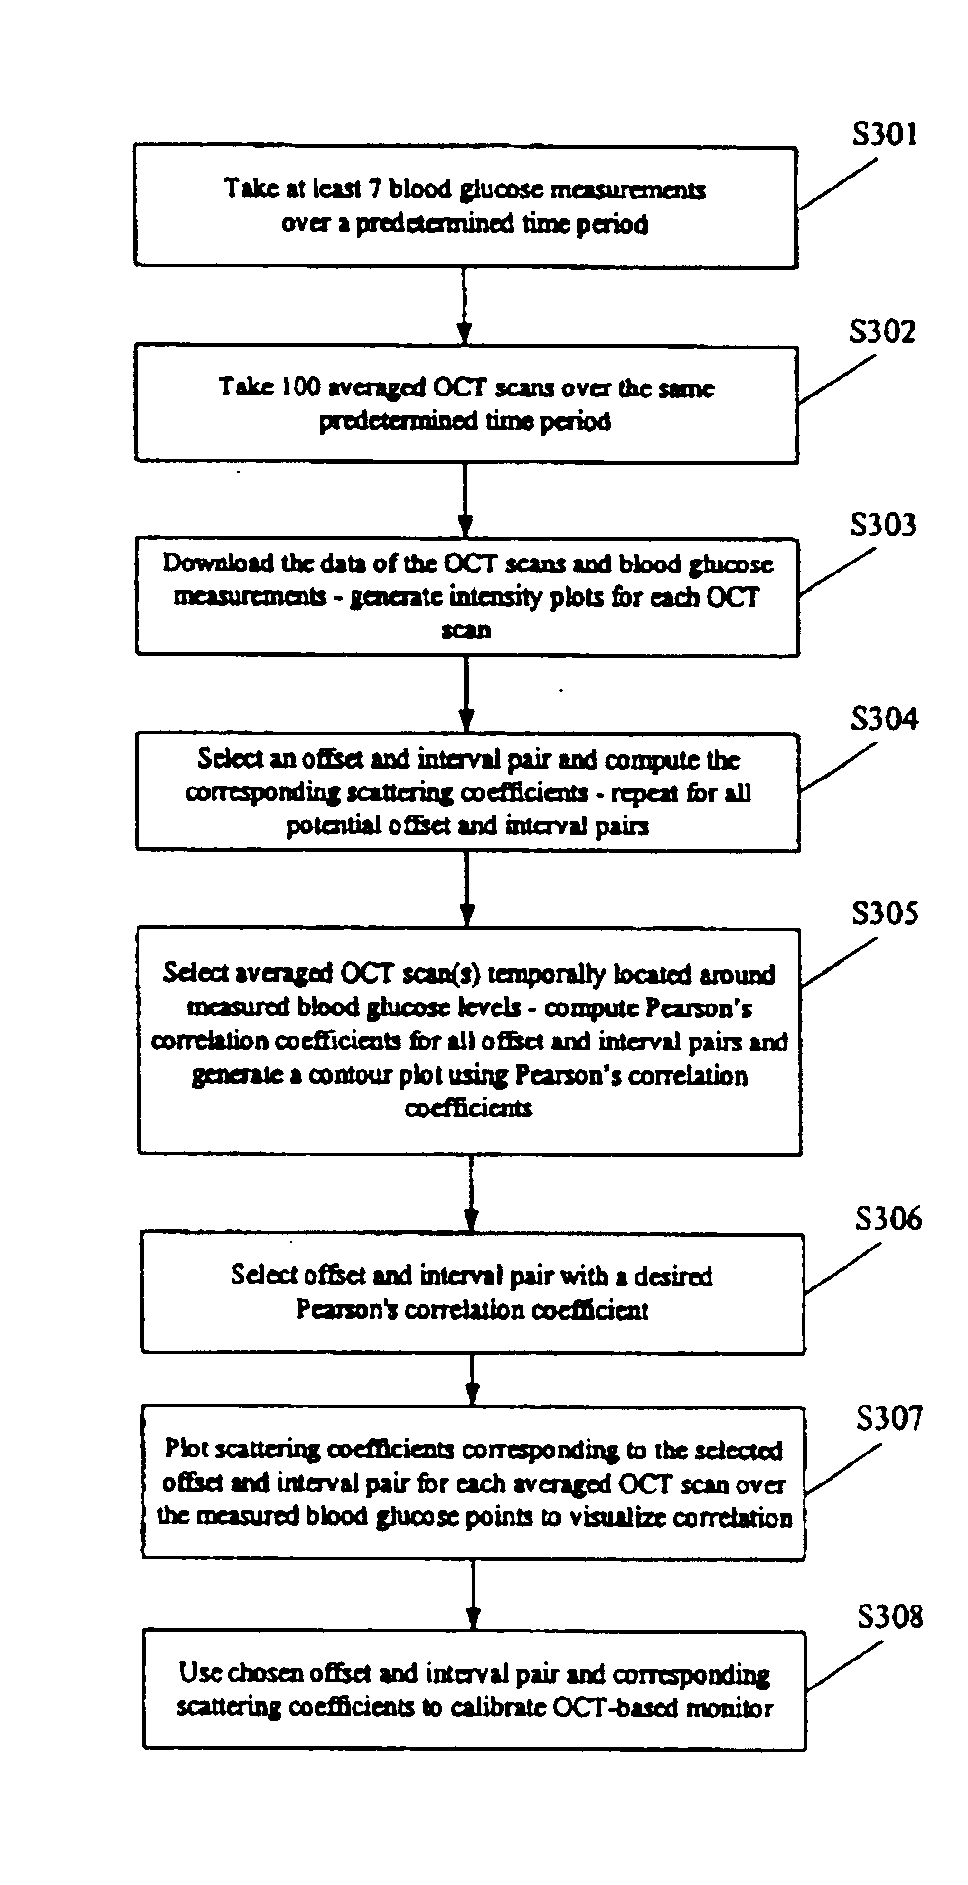
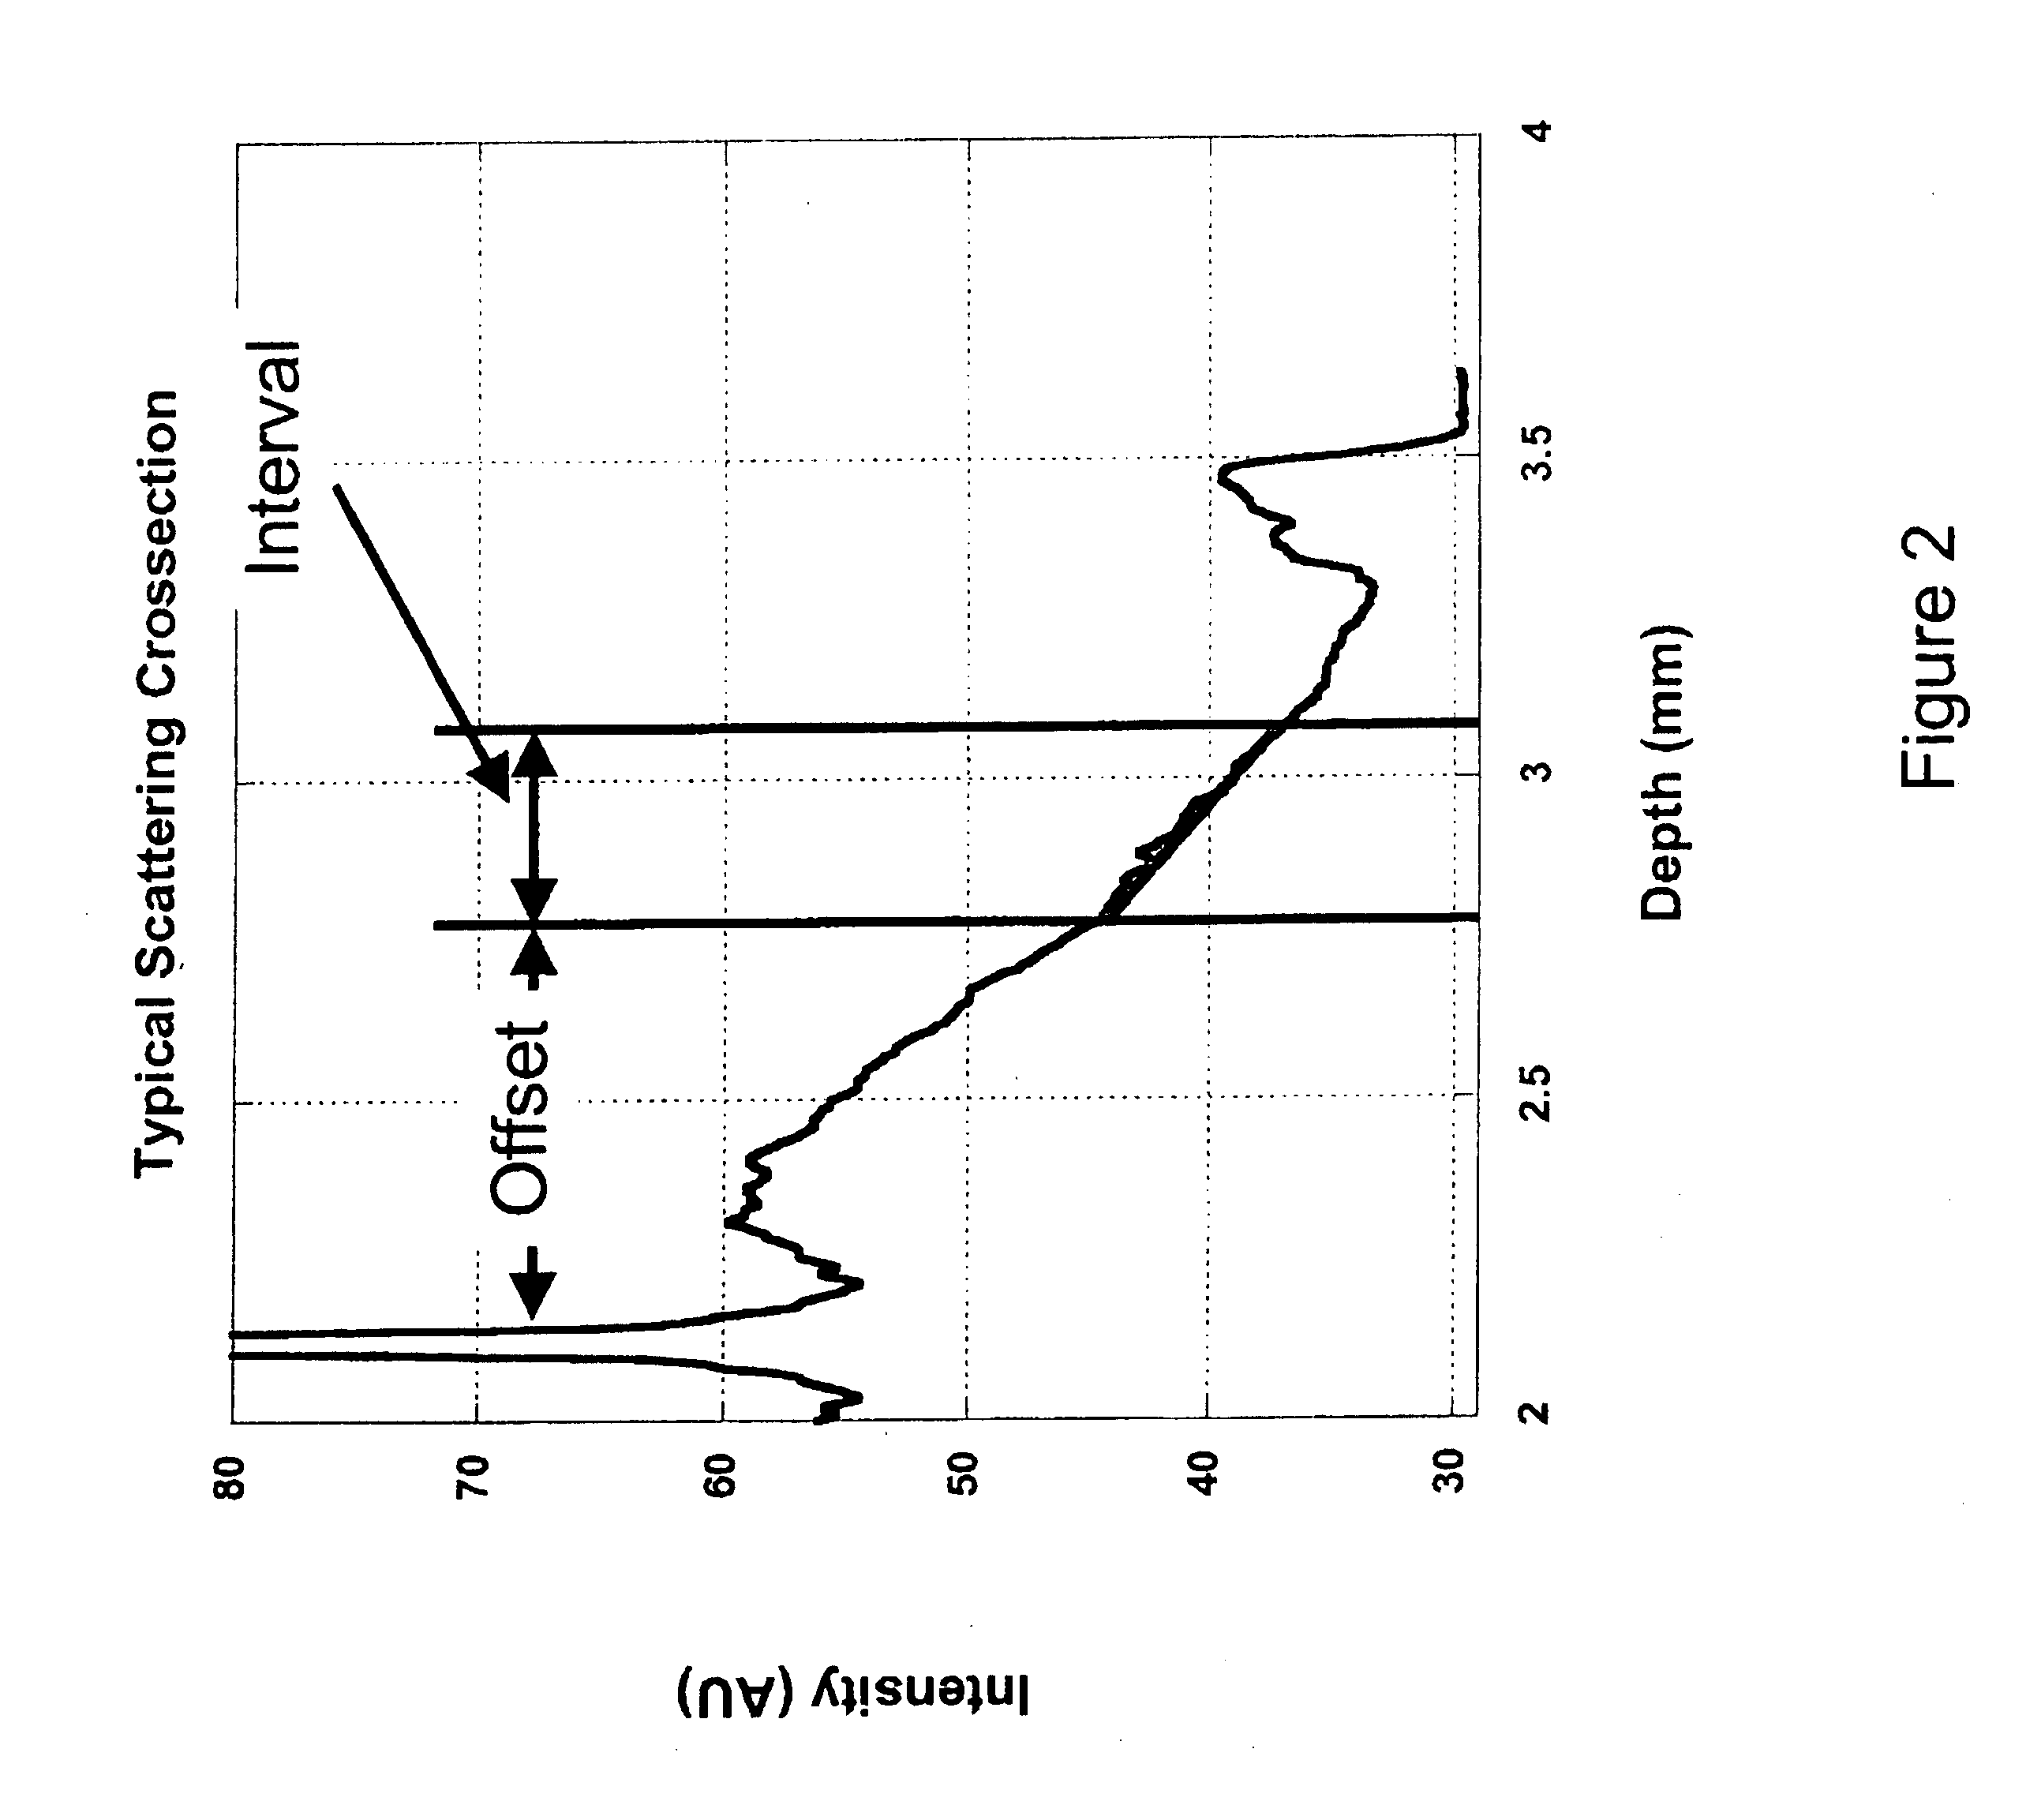
[0008] The present invention provides a noninvasive method of determining estimated blood glucose levels in a biological tissue of a subject using an optical coherence tomography -based blood glucose monitor comprising a sensor and at least one algorithm, the method comprising the steps: (a)selecting a wavelength of light for which μa, an absorption coefficient of the biological tissue, is small relative to μs, a scattering efficient of the tissue for the selected wavelength of light; (b) continuously scanning a two-dimensional surface area of the biological tissue and interferometrically scanning the two-dimensional surface area of the biological tissue in a depth dimension with the light during a time period;(c) averaging the data obtained by interferometrically scanning the two-dimensional surface area of the biological tissue in a depth dimension with the light to generate a multitude of optical coherence tomography scan data lines in the time period, wherein the x-axis of each optical coherence tomography scan data line is depth and the y-axis of each optical coherence tomography scan data lines is intensity; (d) calibrating the optical coherence tomography-based sensor against at least two invasively obtained blood glucose measurements taken during the time period; and (e) allowing the calibrated optical coherence tomography-based sensor and the at least one algorithm to determine an estimated blood glucose level in the biological tissue. In one embodiment, the wavelength of light in step (a) of the method is within the range of about 770 nm to about 1400 nm. In another embodiment, calibrating step (c) of the method further comprising the steps (i) generating a calibration set of estimated blood glucose values; and (ii) applying the calibration set to calibrate the optical coherence tomography-based blood glucose monitor. In another embodiment, in step (c) of the method, the optical coherence tomography-based blood glucose monitor is calibrated by a programmable computer. In another embodiment, substep (i) of calibrating step (c) of the method further comprises the steps: (a) selecting at least two invasively obtained blood glucose measurements obtained over a time period, wherein the at least two measurements are spaced apart by a concentration value of at least about 40 mg / dL; (b) selecting two optical coherence tomography scan data lines, each scan data line having been obtained on or about the time period; (c) computing intensity differences between the two selected optical coherence tomography scan data lines by subtracting a first baseline scan data line (n) from a second, subsequent optical coherence tomography scan data line (n+1) at every point along the two selected optical coherence tomography scan data lines to generate an intensity difference plot; and (d) using the intensity difference plot to determine a multitude of offsets and a multitude of intervals to construct a glucose vector grid comprising a multitude of offset, interval pairs. In another embodiment, the glucose vector grid in step (d) of the method further comprises a percentage change value corresponding to each offset, interval pair. In another embodiment, wherein the method to obtain the percentage change value for each offset, interval pair comprises the steps: (i) calculating a first slope value for a line segment from the first baseline scan data line and a second slope value for a line segment from the second, subsequent optical coherence tomography scan data line for each potential offset and interval pair; and (ii)calculating the difference between the first slope value and the second slope value for each potential offset and interval pair to obtain a percentage change value for each potential offset and interval pair.

Problems solved by technology

The inconvenience associated with this procedure—specifically, the blood extraction and the need for test strips—has led to a low level of compliance by diabetic patients.
Such low compliance can lead to diabetic complications.
Despite significant efforts, these techniques have shortcomings, such as low sensitivity, low accuracy (less than that of current invasive home monitors), and insufficient specificity of glucose level measurement within the relevant physiological range of about 4 mM / L to about 30 mM / L or about 72 to about 540 (mg / dL).
Although it has been proposed that OCT might be useful in measuring blood glucose, a difficulty associated with this technique is identifying which portion(s) of a patient's OCT signal closely correlate(s) with a patient's blood glucose level and then calibrating a change of the identified OCT signal portion(s) to a change in the patient's blood glucose level, so that the changes in a patient's OCT signal may be used to predict changes in the patient's blood glucose level.

Method used


Image

  • Method for data reduction and calibration of an OCT-based blood glucose monitor
  • Method for data reduction and calibration of an OCT-based blood glucose monitor
  • Method for data reduction and calibration of an OCT-based blood glucose monitor

Examples


examples

[0067] The following examples are put forth so as to provide those of ordinary skill in the art with a complete disclosure and description of how to make and use the present invention, and are not intended to limit the scope of what the inventors regard as their invention nor are they intended to represent that the experiments below are all or the only experiments performed. Efforts have been made to ensure accuracy with respect to numbers used (e.g. amounts, temperature, etc.) but some experimental errors and deviations should be accounted for. Unless indicated otherwise, parts are parts by weight, molecular weight is weight average molecular weight, temperature is in degrees Centigrade, and pressure is at or near atmospheric.

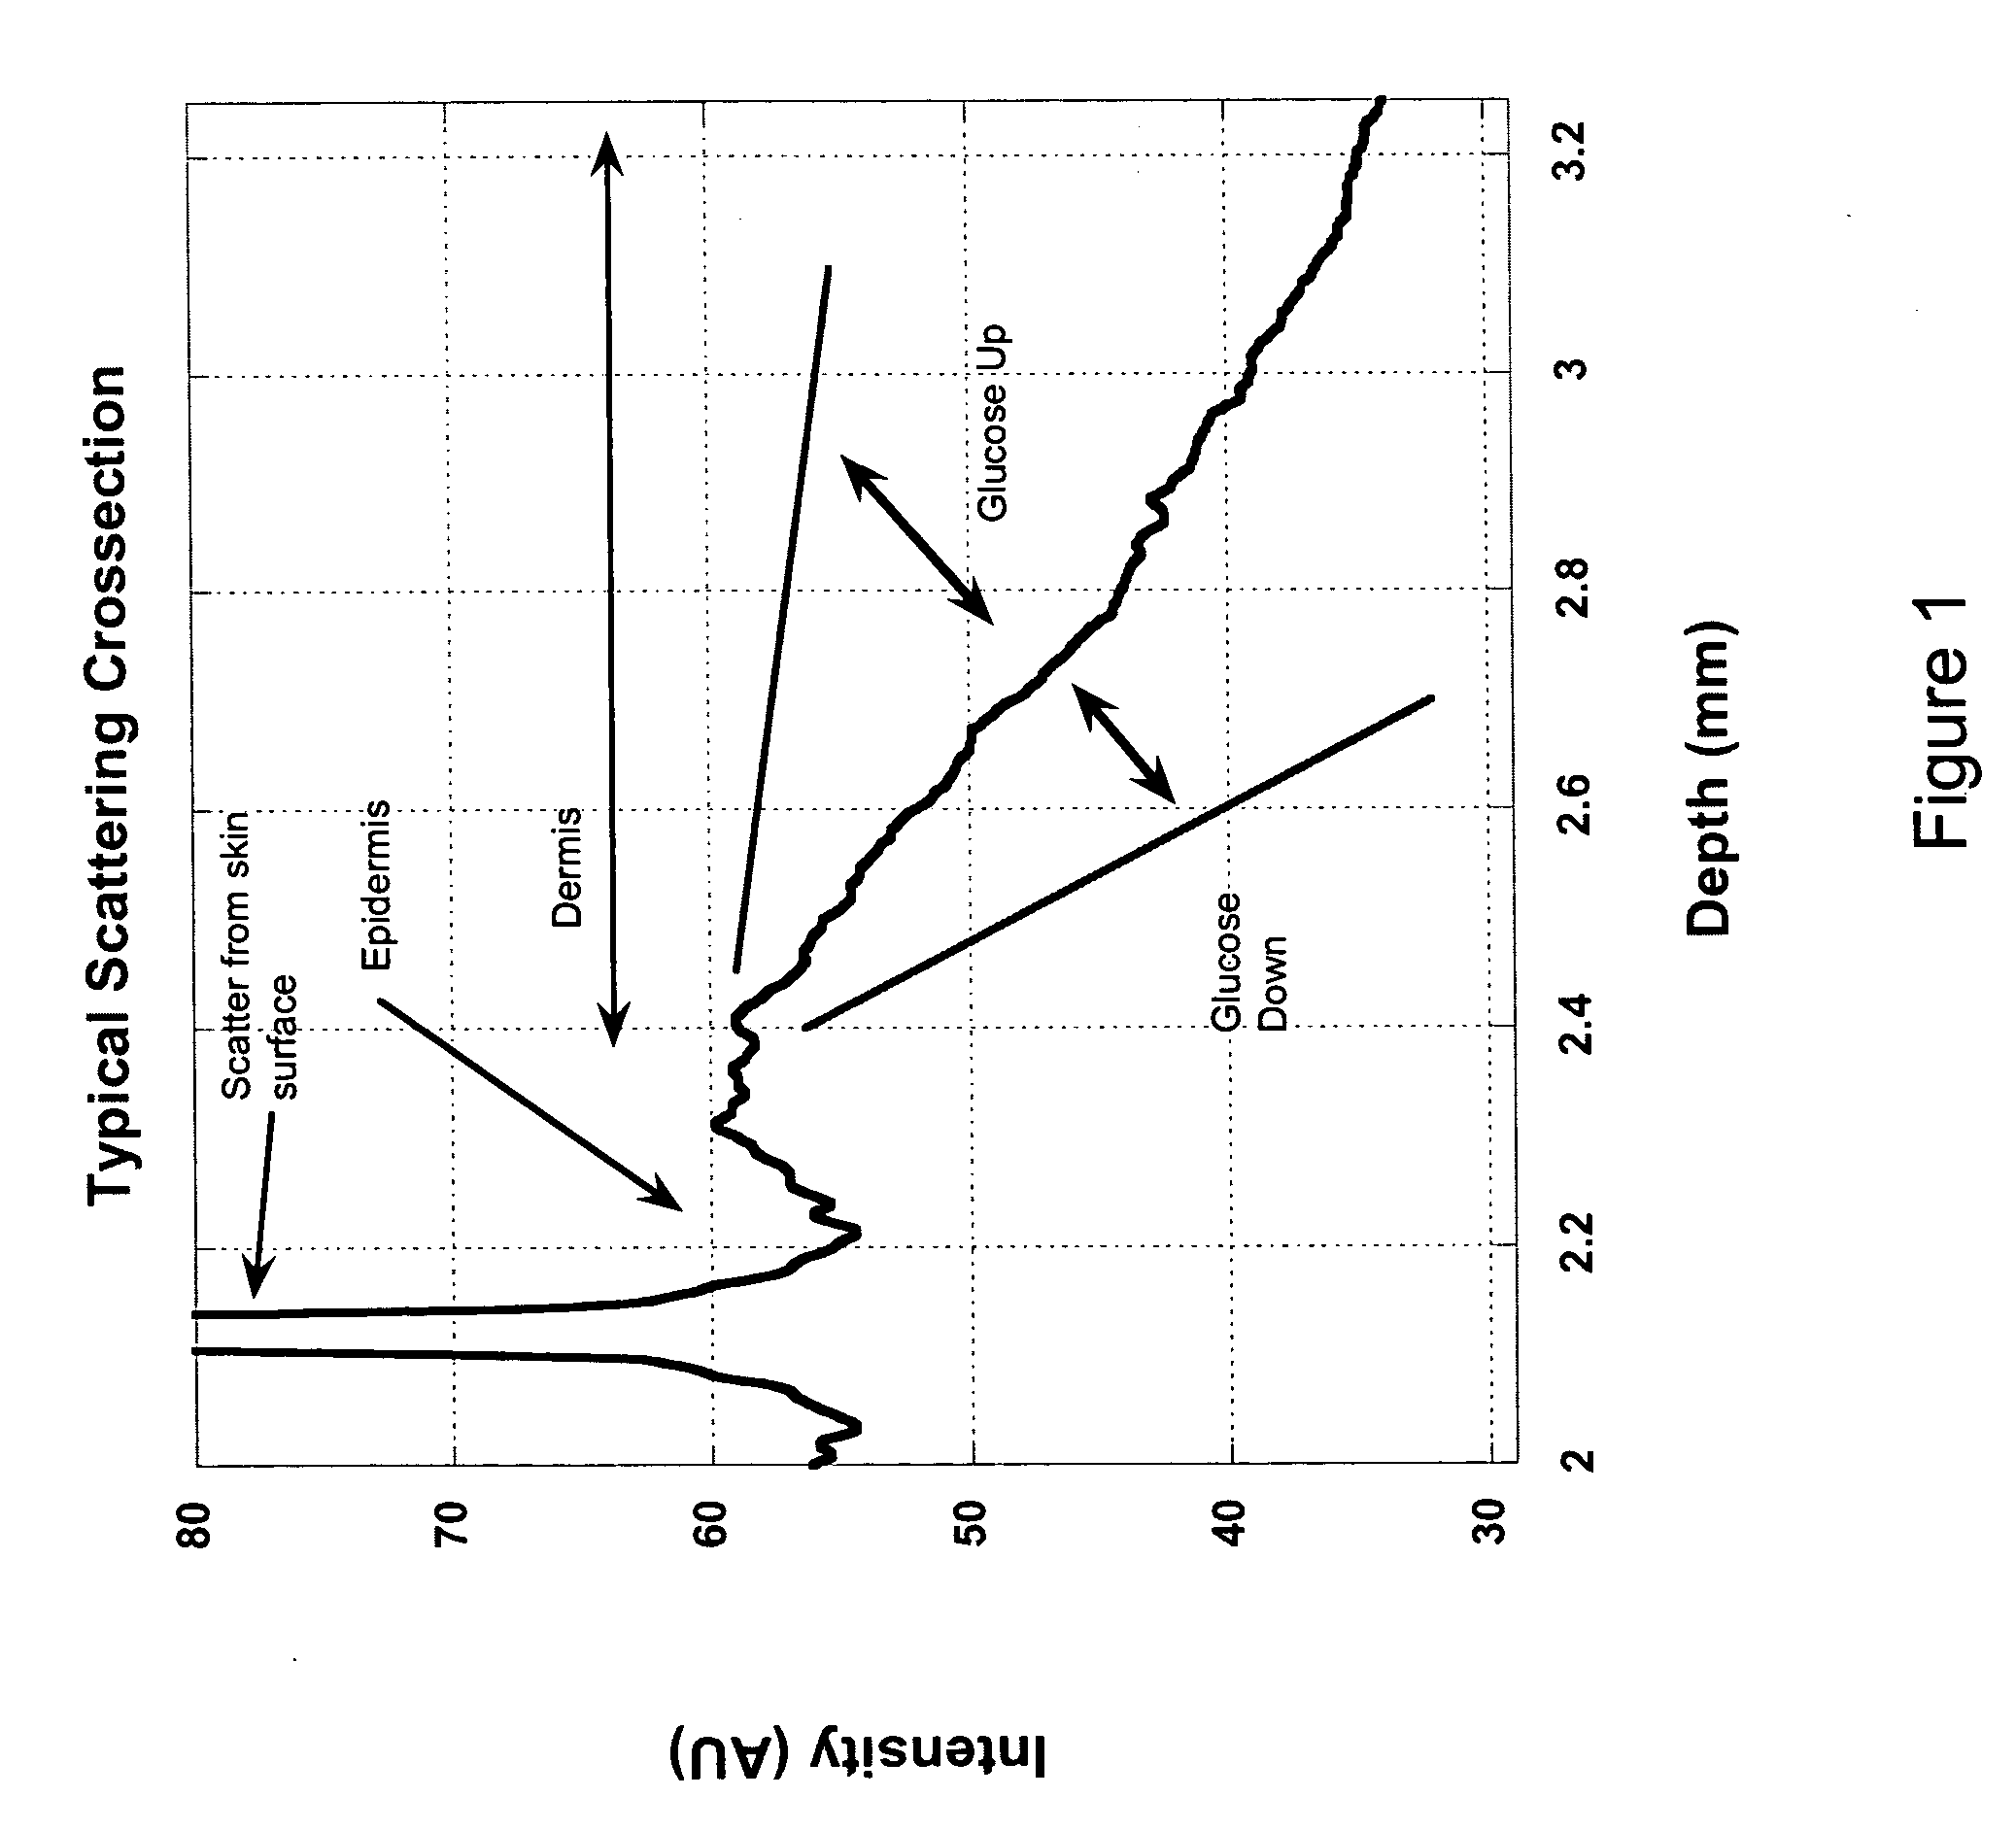
[0068]FIG. 1 shows an intensity profile of light scattered from a biological tissue (human skin) as measured via an OCT-based blood glucose monitor according to an embodiment of the present invention. If an appropriate wavelength of light is chosen (e.g., abo...


PUM


Abstract

The present invention relates to a method for estimating blood glucose levels using a noninvasive optical coherence tomography- (OCT-) based blood glucose monitor. An algorithm correlates OCT-based estimated blood glucose data with actual blood glucose data determined by invasive methods. OCT-based data is fit to the obtained blood glucose measurements to achieve the best correlation. Once the algorithm has generated sets of estimated blood glucose levels, it may refine the number of sets by applying one or more mathematical filters. The OCT-based blood glucose monitor is calibrated using an Intensity Difference plot or the Pearson Product Moment Correlation method.

Description

CROSS REFERENCE TO RELATED APPLICATIONS [0001] This application claims priority benefit of U.S. Provisional Applications Ser. Nos. 60 / 671,007 filed Apr. 13, 2005 and 60 / 671,285 filed Apr. 14, 2005, and of U.S. application Ser. No. 10 / 916,236 filed on Aug. 11, 2004, of which this application is a continuation-in-part, each of which is incorporated herein by reference in its entirety.FIELD OF THE INVENTION [0002] The present invention relates to a method for estimating blood glucose levels using a noninvasive optical coherence tomography- (OCT-) based blood glucose monitor. BACKGROUND OF THE INVENTION [0003] Monitoring of blood glucose (i.e., blood sugar) levels has long been critical to the treatment of diabetes in humans. Current blood glucose monitors involve a chemical reaction between blood serum and a test strip, requiring an invasive extraction of blood via a lancet or pinprick to the finger. Small handheld monitors have been developed to enable a patient to perform this proced...

Claims


Application Information

Patent Timeline
Patent Type & Authority Applications(United States)
IPC IPC(8): A61B5/00A61B5/05
CPCA61B5/0066A61B5/14532A61B5/72A61B5/1455A61B5/441A61B5/7246A61B5/7278A61B2560/0223A61B5/1545
Inventor SCHURMAN, MATTHEW J.SHAKESPEARE, WALTER J.BENNETT, WILLIAM HENRY
Owner MASIMO CORP
Why Eureka
Try Eureka